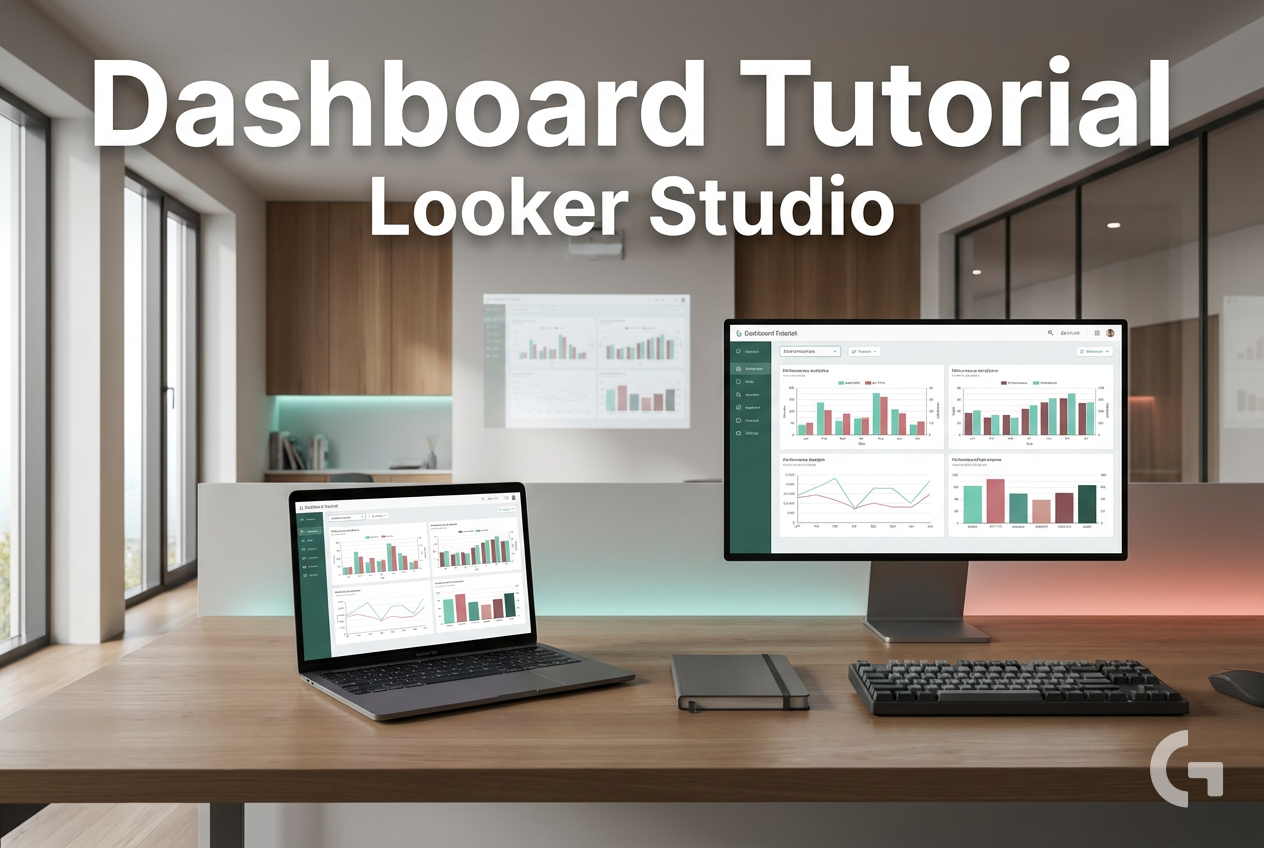
How to Build a Looker Studio Dashboard (Step-by-Step Tutorial)
If you’ve been looking for a Looker Studio dashboard tutorial, you probably have the same problem most marketing teams do: your data lives in too many places. GA4 shows website traffic, Google Ads shows paid performance, and other campaign data often sits somewhere else, which turns reporting into a slow manual process.
That usually means jumping between tabs, exporting numbers, and trying to make everything match. Even when the data is correct, the reporting workflow is often messy. Dates don’t line up, formats differ across sources, and dashboards end up overloaded with charts that don’t help anyone make decisions quickly.
This problem happens because marketing reporting is rarely built in one place from the start. Organic traffic, paid campaigns, and custom calculations often come from different tools. When teams pull everything manually, it becomes easy to create mismatches or lose the big picture. And when a dashboard has too many visuals or poorly placed filters, it stops being useful.

A clean dashboard solves that by giving you one simple view of the metrics that matter most. Looker Studio is Google’s free dashboard tool for building interactive reports, and it can connect to sources like GA4 and Google Sheets to create visuals that update in real time. For marketers, that means less time building reports and more time reading them.
Looker Studio dashboard tutorial: start with a clean structure
The goal is not to add every metric you have. It’s to build a dashboard that helps you scan performance fast.
A useful dashboard should reduce questions, not create more of them.
A practical setup starts with a blank report in Looker Studio and a few core data sources. For a marketing dashboard, that usually means connecting GA4 for web traffic and conversions, and Google Ads for paid campaign data. If you need a simple staging layer or custom calculations before reporting, Google Sheets can also help.
From there, start with the layout before you worry about design. Put your top KPIs at the top as scorecards. Metrics like sessions, conversions, or ROI work well here because they give an immediate summary. After that, add a line chart for trends over time and a bar chart for comparisons across channels or campaigns.
Filters are useful too, but only when they stay simple. A global date range and a channel or campaign filter are usually enough to help people explore the data without cluttering the report. Titles should also be specific, so instead of a vague label, use something like “ROI by Channel (YTD).”
That structure is what makes the dashboard easier to use before you even start refining charts and blended views.
A Connector I Use to Pull Ad Data into Looker Studio
If you’re building dashboards in Looker Studio and need data from ad platforms, this is something I personally use quite often.
Windsor.ai connectors for Looker Studio let you pull marketing data directly into your reports so everything updates automatically.
If you decide to try it, they also offer a 10% discount with the promo code gaillereports.
Looker Studio dashboard tutorial: build the report step by step
Once the structure is clear, the next step is to build the report in a way that stays useful for everyday reporting.
Start by creating a blank report in Looker Studio. After signing in with your Google account, choose Create > Report. This gives you a clean canvas, which is usually better than starting with too many charts and trying to fix the layout later.
Then connect your main data sources. For many marketing teams, that means GA4 for website traffic, events, and conversions, plus Google Ads for paid performance. If you need a simple place to stage data or prepare custom calculations before reporting, Google Sheets can also be added.
When the sources are connected, add your KPI scorecards first. This is the fastest way to make the dashboard readable. Place three to five core metrics at the top so anyone opening the report can understand performance in a few seconds. Sessions, conversions, and ROI are common examples because they give a quick summary without forcing the reader to scan the whole page.
After that, add the charts that explain those KPI numbers.
- Use line charts for trends over time, such as traffic or conversions by day or week.
- Use bar charts for comparisons, such as channel performance or CTR by ad type.
- Use stacked bar charts when you want to show totals split into parts, such as revenue by source.
This chart selection matters because it keeps the report easy to read. A line chart answers “what changed over time,” while a bar chart answers “what is performing better or worse.”
Keep filters useful, not distracting
Filters are helpful when they support fast exploration. A global date range control is usually the first one to add, since almost every stakeholder wants to change the reporting window. After that, a channel or campaign dropdown is often enough for most marketing dashboards.
The simplest setup usually works best because too many filters can make the page harder to use. If people have to think about how the report works before they can read it, the dashboard is carrying too much weight.
It also helps to place filters in a consistent area, such as the top-left section of the report. That makes the dashboard easier to scan and keeps the layout predictable.
A dashboard works best when the reader can understand it in seconds.
Use a practical workflow for multi-source reporting
A lot of reporting issues start before the dashboard itself. The real problem is often that data comes from different places and is prepared differently each time.
A simple workflow can reduce that mess:
- Pull core website and conversion data from GA4.
- Bring in paid campaign data from Google Ads.
- Use Google Sheets when you need quick staging or custom calculations before reporting.
- Blend data in Looker Studio when you need one view across sources.
- Add your scorecards, charts, and filters.
- Share the report link or schedule PDF delivery.
This kind of workflow helps marketers move away from manual exports and repetitive spreadsheet work. Instead of rebuilding the same report every week, you create one dashboard that becomes the main reporting view.
If your reporting setup is larger, BigQuery can also be used for heavier data and scalable queries. That can be helpful when the dashboard needs to work with more data than a lightweight setup can comfortably handle.
Where connectors fit in
Some campaign data may come from sources outside the standard Google tools. In those cases, marketing data connectors such as Supermetrics can help bring ad platform data into the reporting workflow. That data can then be used alongside GA4 in Looker Studio for combined views.
The important part is not adding more tools for the sake of it. It is choosing a workflow that makes the dashboard easier to maintain and easier for your team to trust.
How to make your dashboard easier to read
Good dashboards are not just technically connected. They are organized in a way that helps people understand performance without a long explanation.
A few practical rules help:
- Limit the number of visuals. Around five to seven visuals is often enough for a clean report.
- Group similar metrics together. Paid, organic, and email sections are easier to read than mixed visuals placed randomly.
- Use clear titles. A title like “ROI by Channel (YTD)” says much more than a generic chart name.
- Add context. Comparing to the last period or to a goal helps readers interpret the number, not just see it.
- Choose charts carefully. Lines work for time trends, bars work for comparisons, and pie charts are usually better to avoid.

One practical example is a simple marketing dashboard with four scorecards at the top, one trend line for traffic, one bar chart for channel comparison, and one table or chart for campaign breakdowns. That gives a quick summary, a trend view, and a performance comparison without overwhelming the page.
It is also worth testing the dashboard after setup. Change the date filter, switch channels, and check whether the story still makes sense. If the report becomes confusing as soon as someone interacts with it, the layout or chart choices probably need refinement.
Don’t forget the mobile check
Many dashboards are built on a large screen and only reviewed there. But if a stakeholder opens the report on a phone, the layout can feel very different. Previewing the dashboard on mobile helps confirm that the main KPIs still fit and that the report remains readable.
How marketers can use this setup in real reporting
This kind of dashboard is useful when you need a simple view across channels without spending time on constant manual reporting. A growth team might use it to watch traffic and conversions daily. A founder might use it for a quick weekly check on paid and organic performance. A marketing analyst can use the same dashboard as a central source for recurring updates.
The biggest benefit is speed. When the core numbers are already connected and visualized, it becomes much easier to spot performance changes early. That matters when a campaign starts underperforming and the team needs to react before the next reporting cycle.
It also makes collaboration easier. Instead of sending multiple exports or explaining which spreadsheet version is correct, you can point people to one report with shared filters and clear definitions.
Additional tutorials and resources
If you want to keep improving your reporting workflow, it helps to learn not only dashboard design but also how to organize source data and reporting logic.
- More Looker Studio tutorials for building cleaner reports
- Resources on connecting GA4, Google Sheets, and ad data
- Guides for simplifying dashboard layouts and chart choices
- Practical materials on marketing reporting workflows and automation
Conclusion
A good looker studio dashboard tutorial is not really about adding more charts. It is about building one report that makes marketing performance easier to read, easier to trust, and faster to act on.
If you start with a clean layout, connect the right sources, keep filters simple, and use scorecards and charts with a clear purpose, you can build a dashboard that saves time and supports better decisions. For most teams, that is a much better result than another complicated report that looks impressive but slows everyone down.
Start with your top KPIs, test the report with real filters, and refine it based on how your team actually uses it. That approach usually leads to dashboards people return to instead of dashboards they ignore.