
How to Connect BigQuery to Looker Studio (Beginner-Friendly Tutorial)
If you’ve ever wondered how to connect your BigQuery data directly to Looker Studio for powerful, customizable reporting, you’re in the right place. In this BigQuery Looker Studio tutorial, I’ll walk you through the simple steps to link your BigQuery tables—like those from Google Search Console or GA4 exports—into Looker Studio so you can start visualizing your data immediately. This guide is perfect if you already have data sitting in BigQuery and want to unlock the full potential of Looker Studio dashboards.
As someone who regularly builds Looker Studio dashboards and automates SEO and marketing reports, I want to show you just how straightforward it is to connect BigQuery and Looker Studio, even if you’re just starting out. Don’t be intimidated by BigQuery! Once you have your tables ready, connecting and visualizing your data is a breeze.
Step 1: Prepare Your BigQuery Project and Dataset
Before diving into Looker Studio, make sure you have a BigQuery project set up with your data ready to go. For example, I have a test project that I use as a sandbox where I’ve already connected my GA4 accounts and Google Search Console exports.
When exporting data from platforms like Google Search Console or GA4, it lands in specific datasets within your BigQuery project. These datasets contain tables with raw data, such as site impressions or user events. Having these datasets prepared is the first step.
It’s important to know which dataset and table you want to connect. For instance, in my sandbox project, I have a dataset named after Google Search Console, containing tables with site impression data.
Step 2: Create a Blank Report in Looker Studio
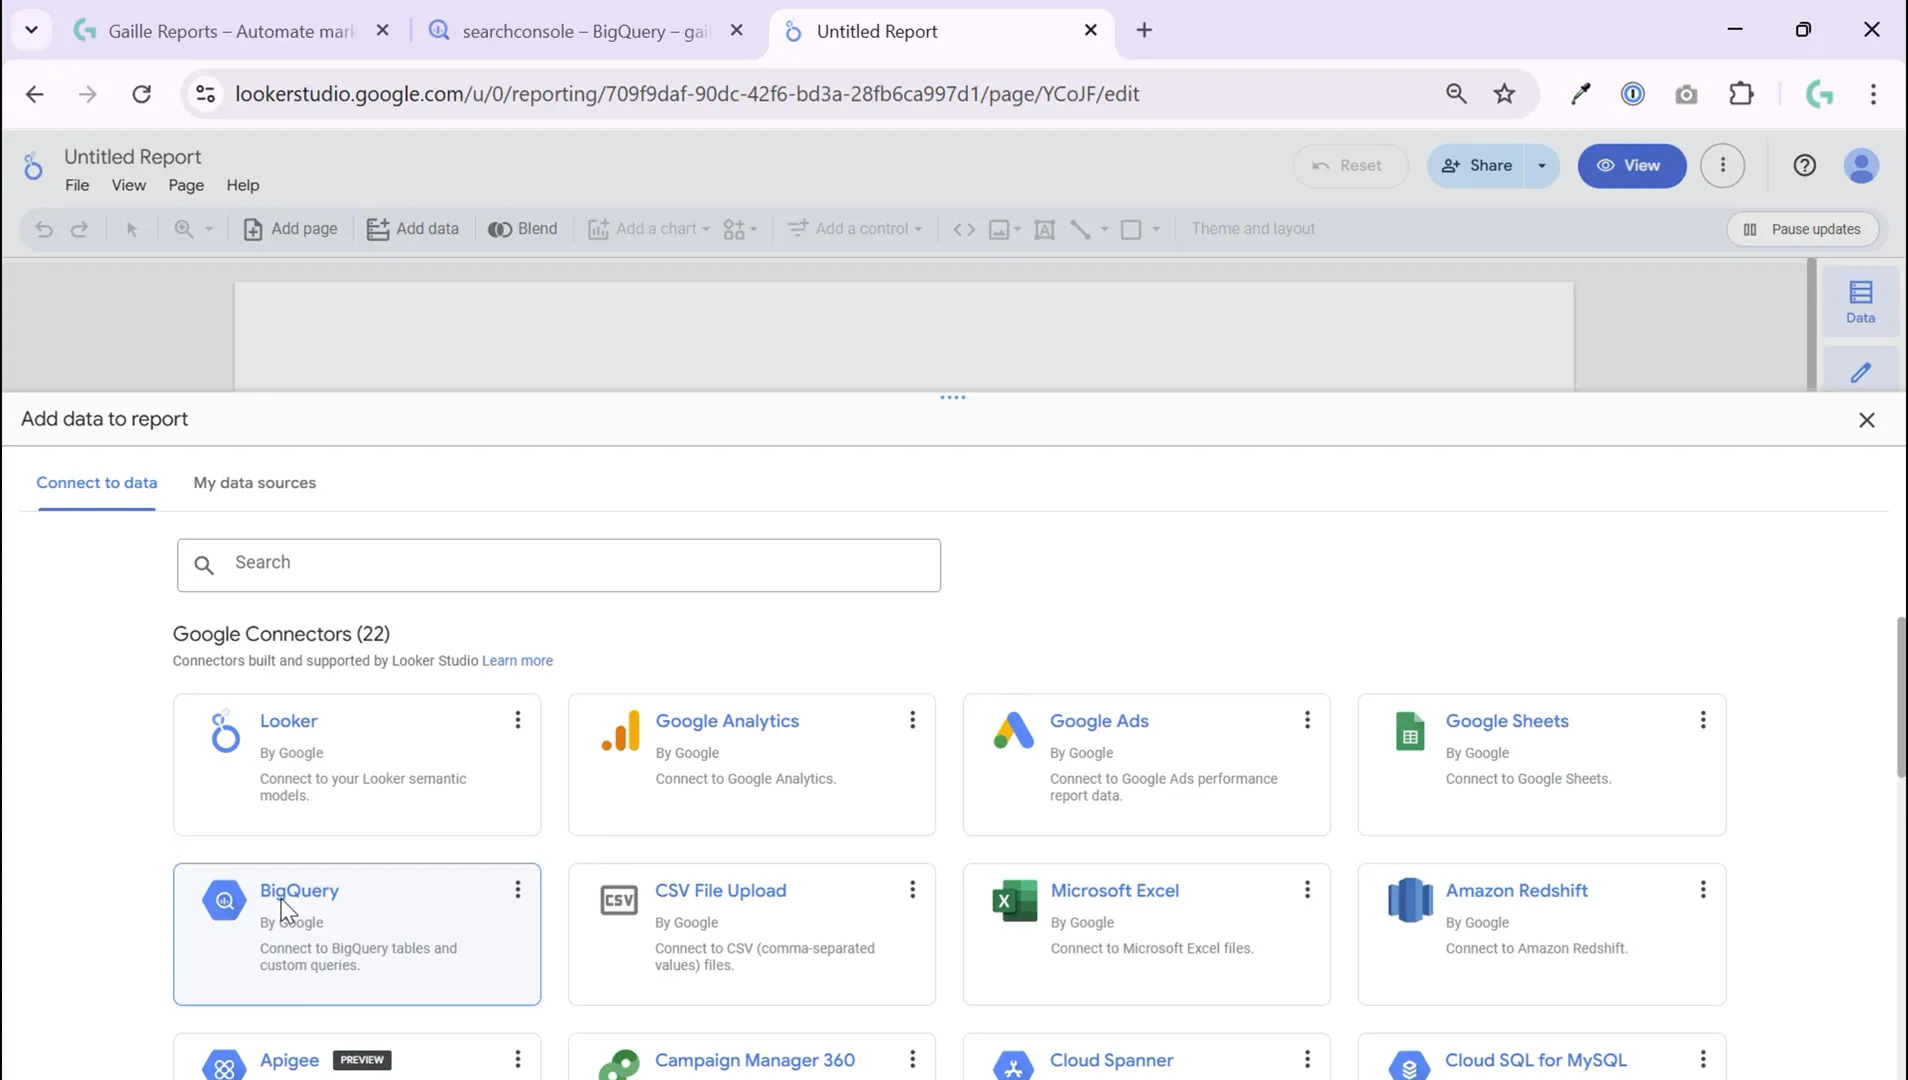
Once your BigQuery data is ready, head over to Looker Studio and create a new blank report. This is where the magic begins. When you create a blank report, Looker Studio immediately prompts you to select a data source, making the process seamless.
Choose BigQuery from the list of connectors. This is just as easy as connecting to Google Analytics or Google Ads, so there’s no need to be intimidated. Looker Studio’s interface makes it straightforward to find and select your BigQuery project.
Step 3: Select Your BigQuery Project and Dataset
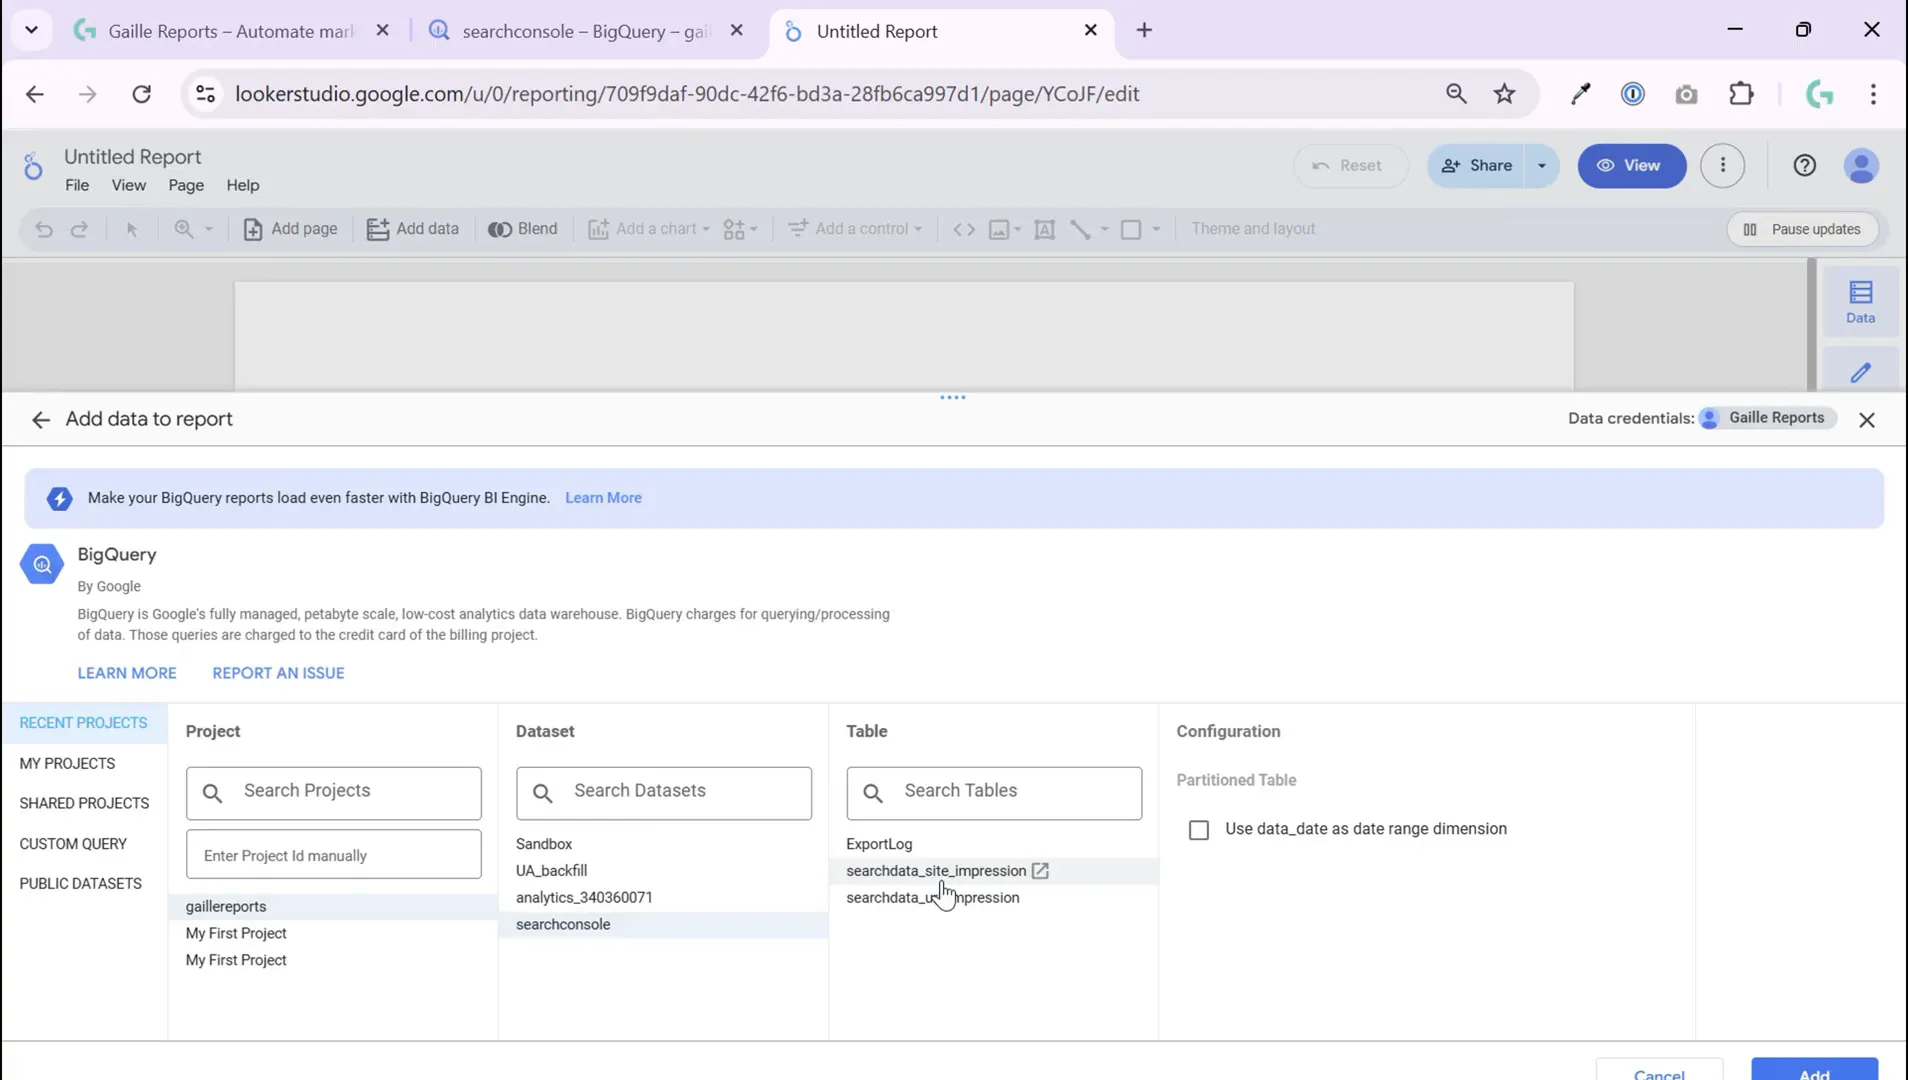
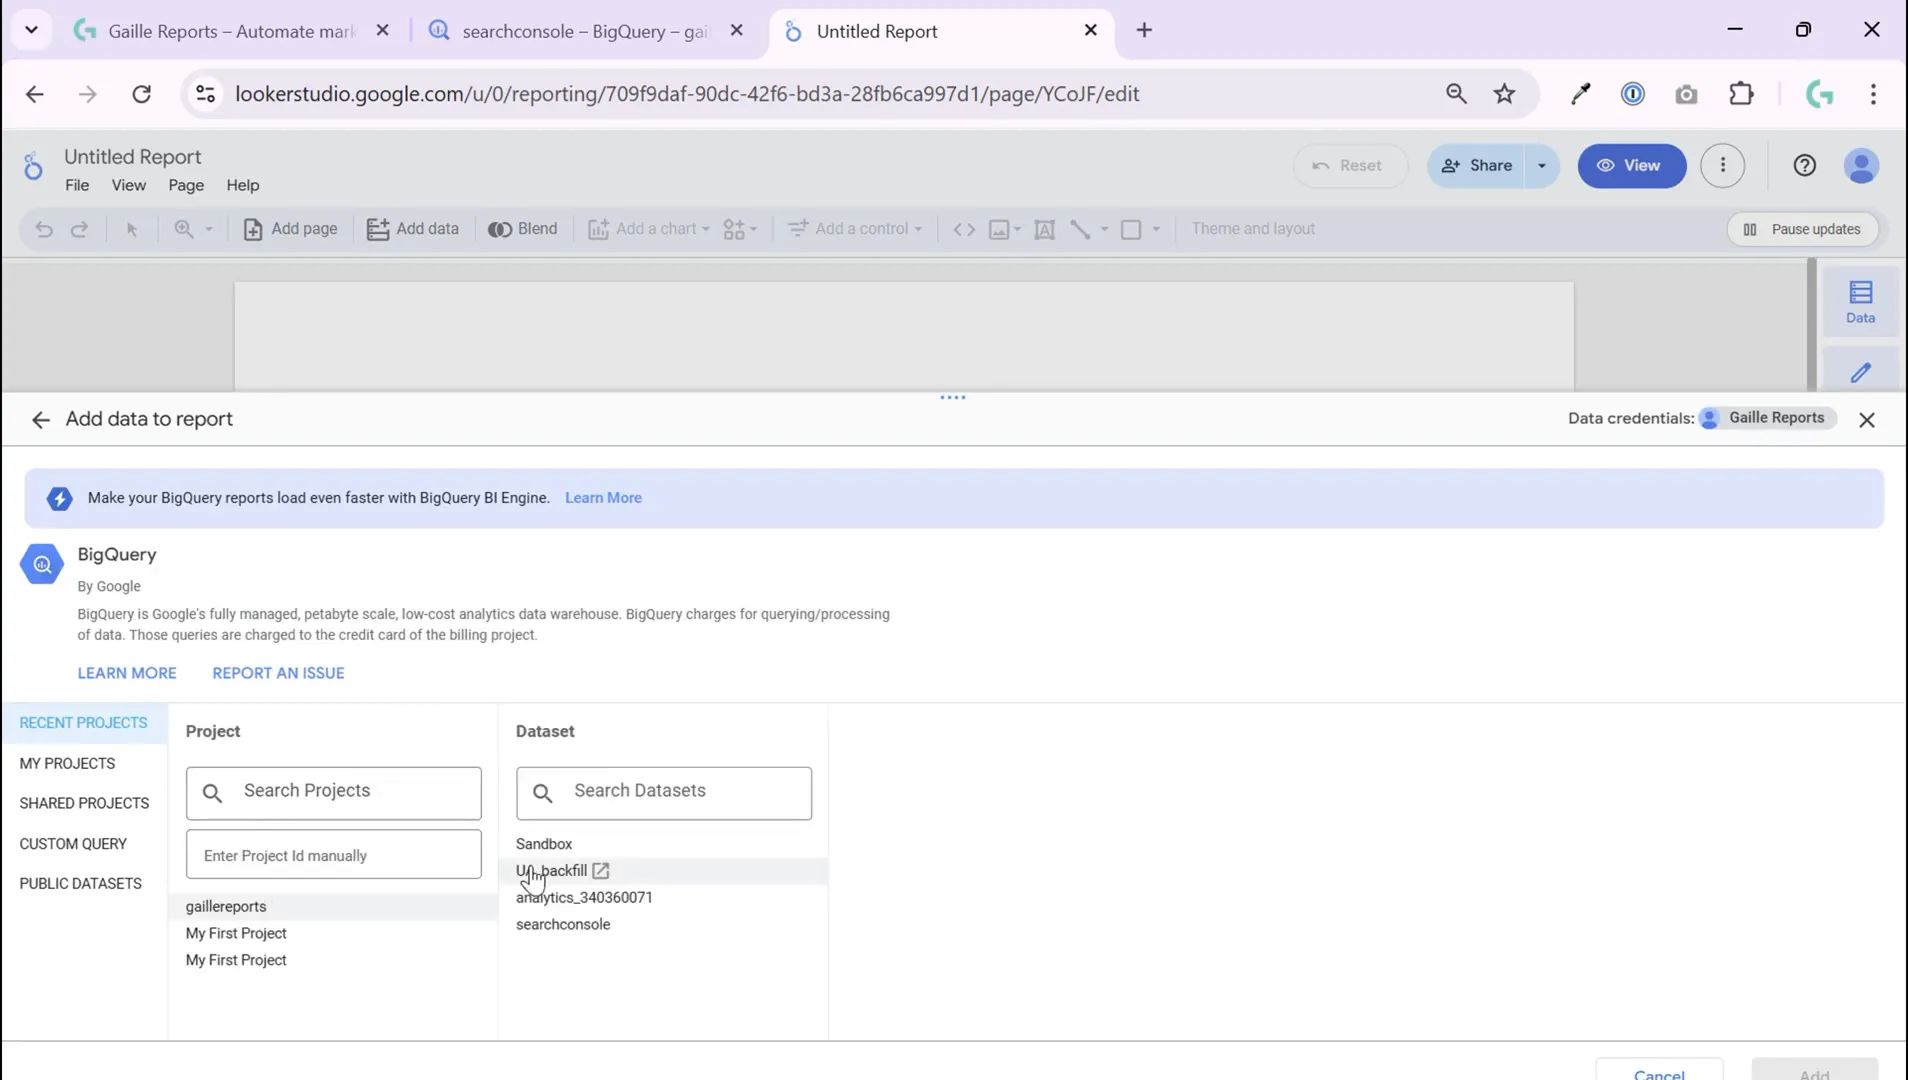
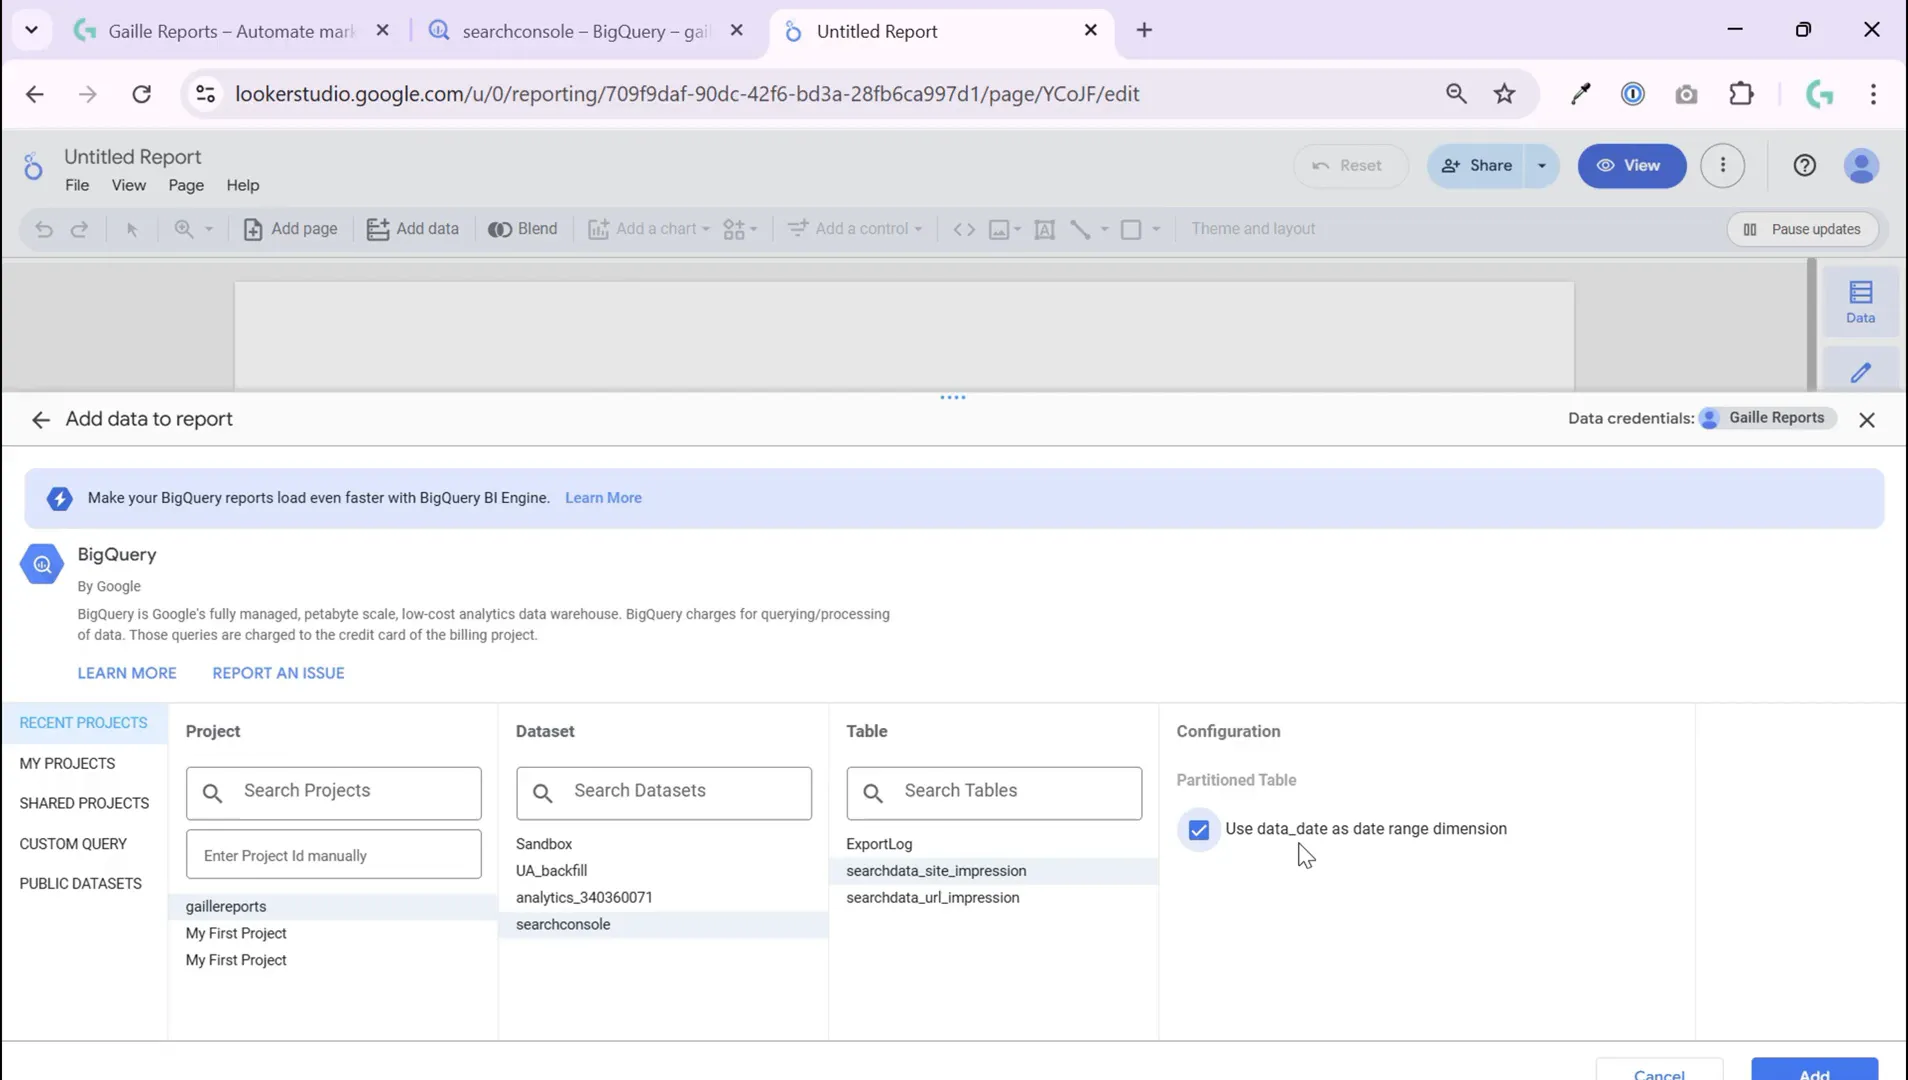
After selecting BigQuery as your data source, you’ll be able to search for and select your project. In my case, it’s the sandbox project I mentioned earlier. Once you select the project, you’ll see the available datasets within it.
Choose the dataset that contains the table you want to visualize. For example, I selected my Google Search Console dataset, then picked the table with site impressions data. This is the exact dataset and table I want to bring into my Looker Studio report.
Step 4: Configure the Data Source and Add to Report
When you select your table, Looker Studio lets you configure the data fields. For instance, you can specify which field to use as the date range dimension. This is crucial for filtering your data by date in your reports.
In my example, I chose the date field from the site impressions data to serve as the data range dimension. After setting this, you simply add the data source to your dashboard.
At this point, your BigQuery table is connected, and you can start creating charts, tables, and other visualizations using this data.
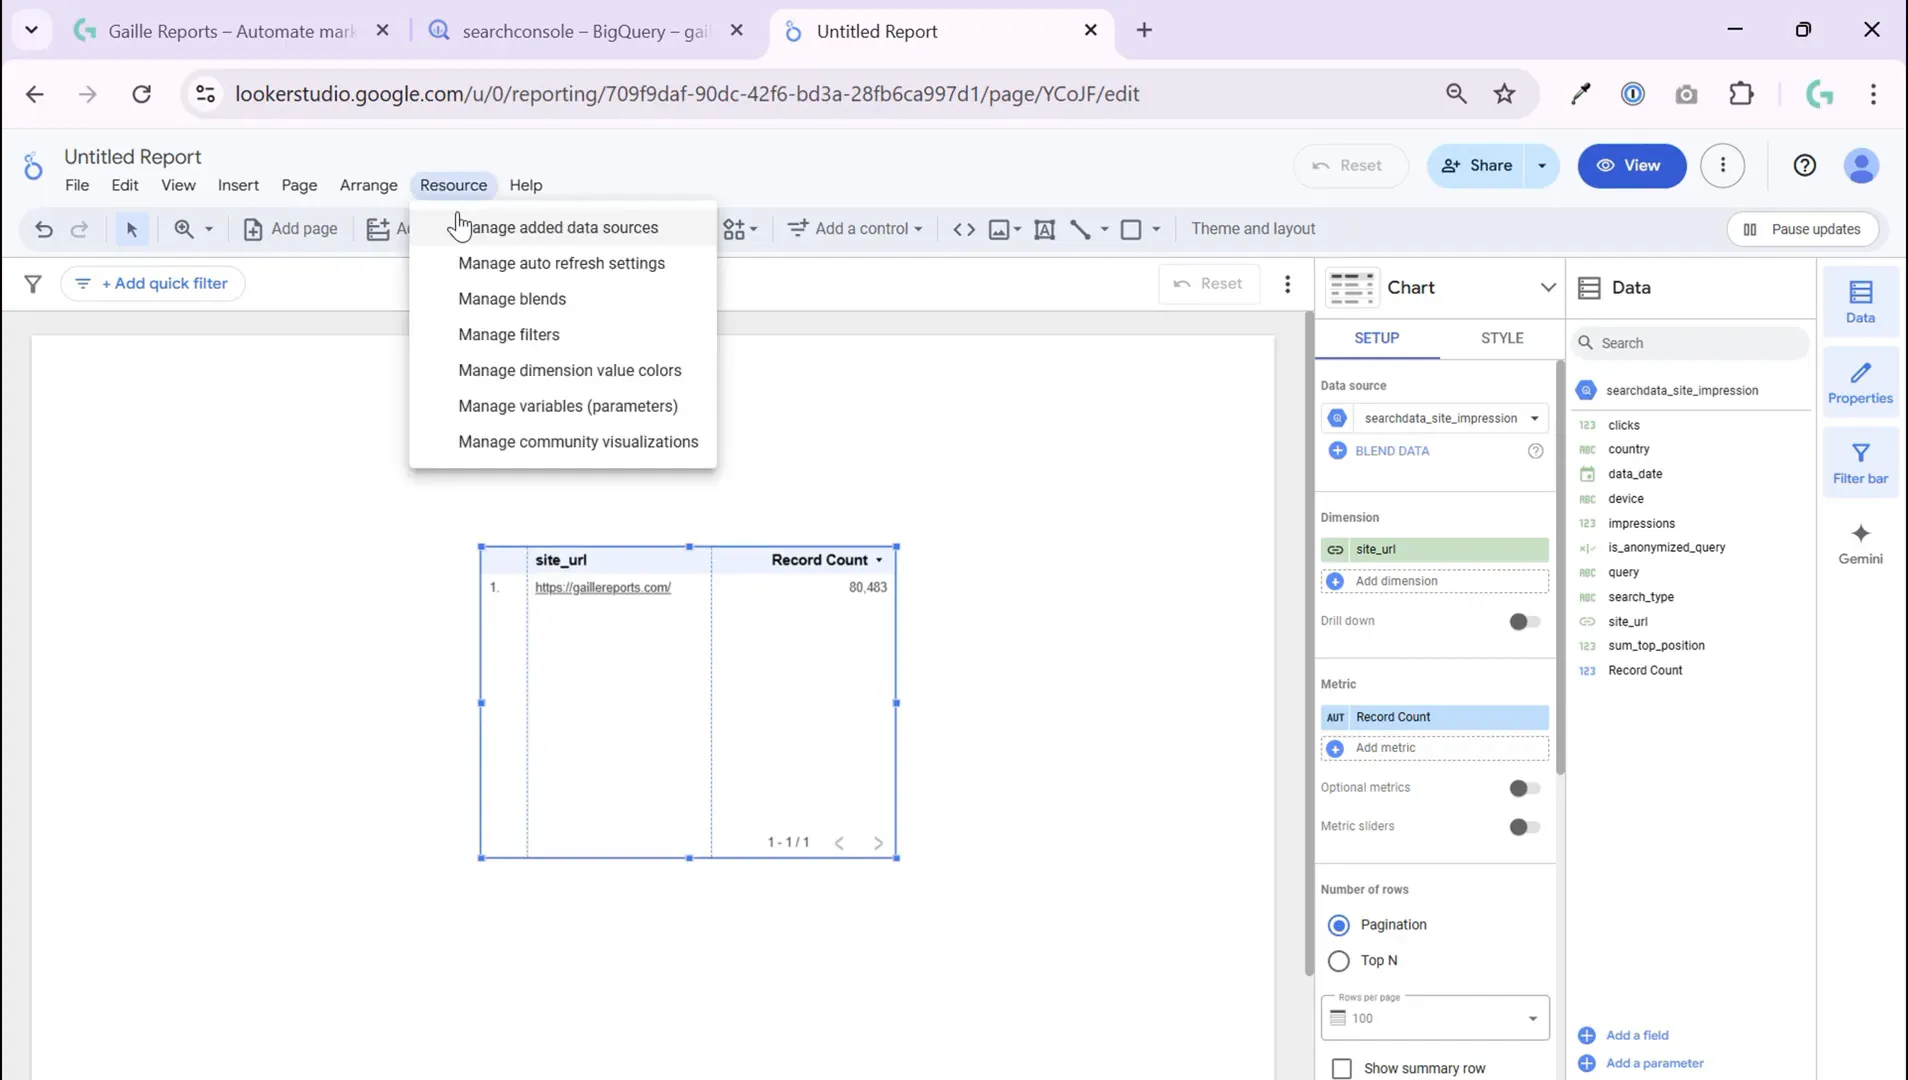
Step 5: Manage and Edit Your BigQuery Data Source
If you want to review or make changes to your BigQuery connection, Looker Studio makes it easy. Go to the “Resources” menu in your report, then select “Manage added data sources.” Here you’ll see your connected BigQuery table with options to edit the data source settings.
This is useful if you need to tweak field types, add calculated fields, or adjust how data is presented without reconnecting from scratch.
Step 6: Preparing Raw GA4 Data for Visualization (Advanced Topic)
Connecting BigQuery tables is the easy part, especially if your data is already structured for reporting. However, when working with raw GA4 data exported to BigQuery, things get a bit more complex.
Raw GA4 data is very detailed and requires preparation before it can be effectively visualized in Looker Studio. This includes flattening nested fields, creating calculated metrics, and structuring event data into sessions or user-level summaries.
While this tutorial focuses on connecting your first BigQuery table, preparing GA4 data for visualization is a deeper topic that I’ll cover in future posts. If you’re interested in learning how to transform and optimize GA4 data for Looker Studio dashboards, stay tuned!

Tips for a Smooth BigQuery Looker Studio Experience
- Don’t be intimidated by BigQuery: If you already have your tables ready, connecting them to Looker Studio is just as easy as connecting Google Analytics or Google Ads.
- Choose the right dataset and table: Make sure you know which dataset and table contain the data you want to visualize.
- Set the data range dimension: Always specify the date or time field to enable date filtering in your reports.
- Manage your data sources: Use Looker Studio’s resource management to edit and optimize your data connections.
- Prepare your raw data: For raw GA4 data, invest time in data preparation before visualization for best results.
Conclusion
Connecting BigQuery to Looker Studio opens up a world of possibilities for creating customized, powerful dashboards that integrate your SEO, marketing, and analytics data in one place. As demonstrated, the process of linking your first BigQuery table is straightforward—just select your project, dataset, and table, configure your data fields, and add the data source to your report.
While the initial connection is simple, the real power comes when you start preparing and structuring your data for meaningful insights, especially with complex sources like GA4. I encourage you to explore these steps and get comfortable with the basics first.
For those eager to dive deeper into preparing and visualizing raw GA4 data, I’ll be sharing more advanced tutorials soon. Be sure to subscribe to my channel and follow along for more tips and hands-on guides on automating SEO and marketing reports using Looker Studio and BigQuery.
Remember, BigQuery and Looker Studio together are a dynamic duo for data-driven decision-making—don’t hesitate to get started today!