
Compare tools used for marketing analytics.

Marketing analytics tools are supposed to make reporting easier, but for many teams they do the opposite. Instead of giving one clear view of performance, they often leave marketers jumping between GA4, ad platforms, CRM reports, spreadsheets, and dashboard tools just to answer basic questions.
Why marketing analytics tools often feel harder than they should
The core problem is not usually a lack of data. It is that marketing data lives in too many places, and each system measures performance differently. A conversion in one platform may not match a lead in another. Attribution windows differ. Naming conventions differ. Time zones differ. That is why reports often conflict, even when everyone is looking at the same campaigns.
This leads to familiar issues: manual exports, broken spreadsheet formulas, slow reporting cycles, incomplete funnel views, and dashboards that are hard to trust. Many teams assume they need a better dashboard, but often the real issue is the workflow behind the dashboard.
If reporting feels messy, the problem is usually not the chart — it is how the data gets there.
What marketing analytics tools actually help with
Marketing analytics tools help collect, organize, analyze, and visualize data. But not every tool solves the same problem.
In practice, teams usually need a mix of tools:
- GA4 for website and app measurement
- Google Sheets for quick analysis, cleanup, and lightweight reporting
- Looker Studio for dashboards
- BigQuery when data volume or complexity grows
- Looker and LookML for governed analytics and reusable metric definitions
- Make.com and marketing data connectors for automating data movement between systems
That mix matters because marketing reporting is rarely just one task. You may need one tool to check traffic sources, another to review campaign spend, and another to combine ads, CRM, email, and analytics into one reporting view.

The first step to choosing the right setup
A practical starting point is simple: use the right tool for the right job. Expecting one platform to handle traffic analysis, SEO performance, CRM reporting, automation, and dashboarding usually creates more confusion, not less.
A better approach is to first identify what you need most: measurement, reporting, centralization, or automation. From there, it becomes much easier to decide whether your team mainly needs a quick reporting layer in Looker Studio, a central source in BigQuery, or a lighter workflow built around Sheets and connectors.
Once that is clear, the next step is making sure your data is consistent before you build reports on top of it.
A Tool I Use to Centralize Marketing Data
## Windsor.ai
When I need to move marketing data from ad platforms into BigQuery or Looker Studio, I often use Windsor.ai.
It saves a lot of time because it can automatically pull data from platforms like Facebook Ads, Google Ads, TikTok Ads and send it straight into your reporting stack.
If you decide to try it, they also offer a 10% discount with the promo code gaillereports.
How to make marketing data consistent before you build reports
If your numbers do not match across tools, building another dashboard usually will not fix the issue. The more useful step is to clean up the reporting logic first.
A practical way to do that is to standardize the parts of reporting that often create confusion:
- channel definitions
- conversion events
- campaign naming
- date ranges
- attribution logic
- lead and revenue definitions
For example, if one team reports on “leads” from the CRM and another reports on “conversions” from GA4, the numbers may both be correct but still not describe the same thing. The same happens when campaign names are entered differently across platforms or when teams compare reports built with different date settings.
This is why consistent definitions matter so much. Clean charts are helpful, but shared logic behind those charts is what makes reporting trustworthy.
A simple workflow for choosing and using marketing analytics tools
When teams compare marketing analytics tools, it helps to think in workflow order instead of comparing tool lists side by side.
1. Start with the question you need to answer
Before choosing a tool, define the reporting job.
For example, are you trying to understand:
- where website traffic came from
- which campaigns drove conversions
- how SEO performance changed over time
- which channel contributed most to revenue
- whether numbers are consistent across systems
Different questions usually require different tools. GA4 helps with website and app measurement. SEO tools like Semrush or Ahrefs are used for search performance. CRM and ad platforms are needed for pipeline and spend data. Looker Studio is useful for dashboards. BigQuery becomes helpful when data needs to be centralized. Looker and LookML are more relevant when teams need governed reporting and reusable metric definitions.
2. Map where each number comes from
Once the key questions are clear, list the systems that hold the data.
- GA4 for site behavior
- ad platforms for spend and clicks
- CRM for leads and deals
- email platforms for campaign results
- social tools for engagement
- SEO tools for organic visibility
This step sounds basic, but it often highlights why reporting feels messy. If performance is spread across six systems, then a dashboard can only be as reliable as the process used to bring those numbers together.
3. Decide whether you need a light setup or a centralized one
Not every team needs the same reporting stack.
For smaller reporting needs, Google Sheets, GA4, and Looker Studio may be enough. Sheets works well for quick analysis, manual checks, and small reporting tasks. Looker Studio is useful when you want a visual dashboard for a team or client.
As reporting grows, many teams move toward a more centralized setup. BigQuery is useful when marketing data needs to be stored, transformed, or joined at scale. Instead of building every dashboard directly from each source, teams can centralize data first and then build cleaner reporting layers on top.
This tends to reduce the problem of different dashboards showing different versions of the same metric.
4. Automate repetitive reporting where possible
Manual reporting is one of the biggest reasons marketing analysis feels slower than it should.
Automation tools and connectors can help with routine tasks such as:
- pulling data from ad platforms and CRMs
- refreshing dashboards automatically
- reducing copy-paste work
- keeping reports current without manual exports
Marketing data connectors such as Supermetrics or Windsor.ai help move data from platforms into Sheets, BI tools, or warehouses. Tools like Make.com are useful for automating simple workflows and alerts.
That does not mean every process needs to be fully automated. But if the same export-and-cleanup work happens every week, it is usually a good sign that the workflow needs improvement.
Reliable reporting starts with repeatable inputs.
Practical examples marketers can apply
Example 1: A lightweight reporting workflow
A smaller team may only need a simple setup to answer weekly performance questions.
- Use GA4 to review website traffic and behavior
- Use ad platforms and CRM reports to check spend, leads, or deals
- Use Google Sheets for quick cleanup and manual checks
- Use Looker Studio to present the main results in one dashboard
This kind of workflow is often enough when the number of sources is limited and reporting logic is still manageable without a warehouse.
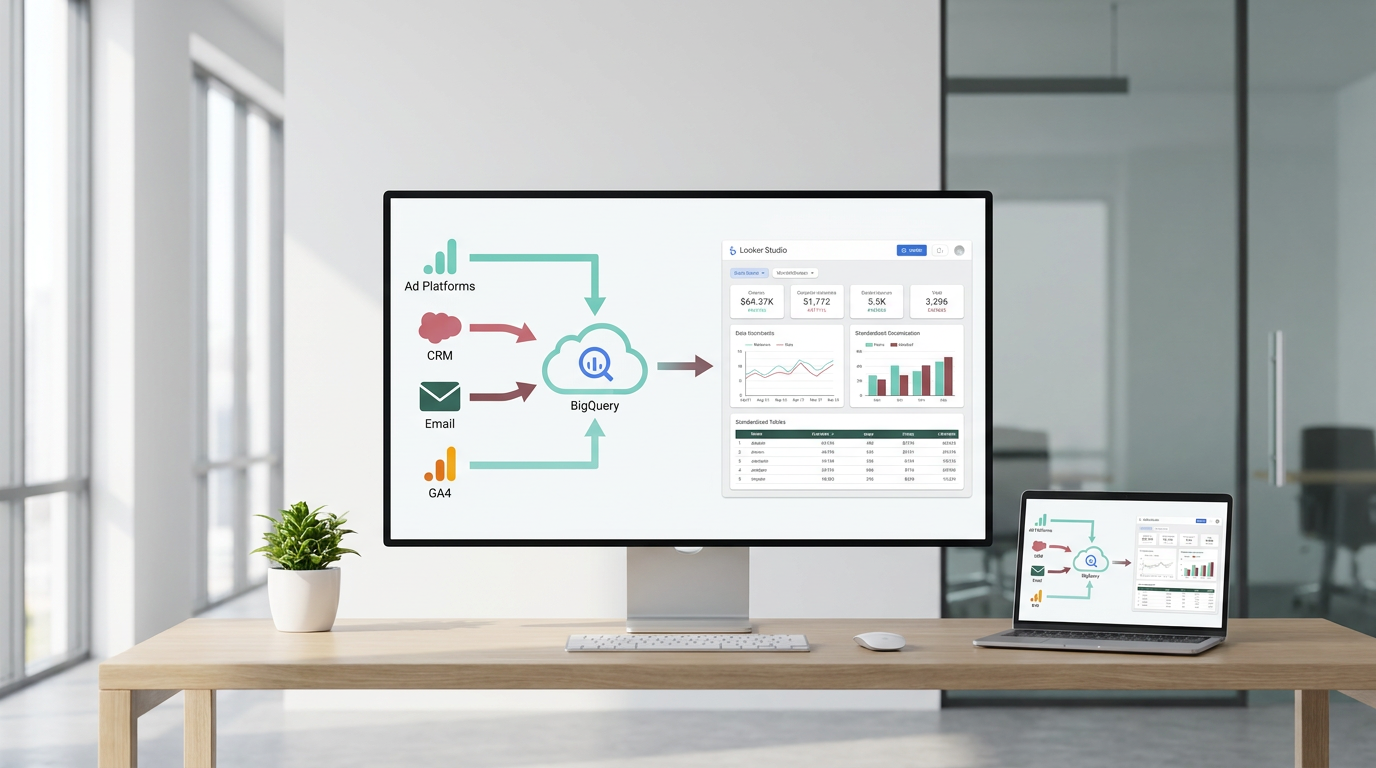
Example 2: A more centralized reporting workflow
When a team has more sources and more reporting complexity, a warehouse-first approach is often more practical.
- Load data into BigQuery from core marketing systems
- Organize and combine the data before dashboarding
- Use Looker Studio for visual dashboards
- Use Looker and LookML when shared metric definitions and governed models are needed
This approach helps when teams want cleaner reporting layers and more consistency across reports.
Example 3: Automating small but repetitive tasks
Not every automation project needs to be large. Simple workflows can still remove a lot of manual work.
For example, Make.com can automate simple actions such as moving form submissions into a spreadsheet or sending notifications when campaign data updates. Small improvements like this can reduce reporting delays and make day-to-day analysis easier.
How to compare marketing analytics tools without overcomplicating it
When evaluating options, a few practical checks usually matter more than a long feature comparison.
- Start with the reporting problem, not the tool list
- Decide which metrics must be trusted across the team
- Check whether the tool supports your main data sources
- Think about refresh frequency and maintenance effort
- Avoid building dashboards on top of messy, unstandardized data
- Use spreadsheets for quick tasks, not as the long-term source of truth
- If reporting is growing, consider a warehouse-first approach
This helps keep the process practical. Many teams spend too much time comparing tools as if one platform will solve everything. In most cases, the better result comes from choosing a setup that matches the actual workflow: measurement, reporting, centralization, or automation.
Helpful resources for improving your reporting workflow
If you want to go deeper, it helps to keep learning from practical examples and tool-specific tutorials. Additional resources are available for building better reporting workflows, connecting marketing data sources, and simplifying dashboards.
- tutorials for GA4, Google Sheets, Looker Studio, BigQuery, and Looker workflows
- practical guides for connecting marketing data sources
- examples of dashboard and reporting setups for marketing teams
- resources for automating repetitive reporting tasks
Choose the workflow first, then the tools
The best marketing analytics tools are not necessarily the most advanced ones. They are the ones that fit the reporting job you need to do and make your numbers easier to trust.
For some teams, that means a simple setup with GA4, Google Sheets, and Looker Studio. For others, it means centralizing data in BigQuery, using connectors to reduce manual work, and adding Looker when shared definitions become more important.
The key idea is simple: do not start with the dashboard design or the longest tool list. Start with the reporting problem, standardize the logic behind your metrics, and build a workflow that removes unnecessary manual work.
When you do that, reporting becomes faster, cleaner, and much easier to use in real marketing decisions.

Leave a Reply