
How to Plan Your 2026 eCommerce Marketing Budget (Template)

December and January are the months I plan budgets for the year ahead. I built a practical, ready-to-use eCommerce marketing planner that combines Google Sheets and Looker Studio so you can plan budgets by channel, produce monthly and yearly forecasts, and track key promo events without wrestling messy spreadsheets.
If you prefer a visual walkthrough, watch the full tutorial here:
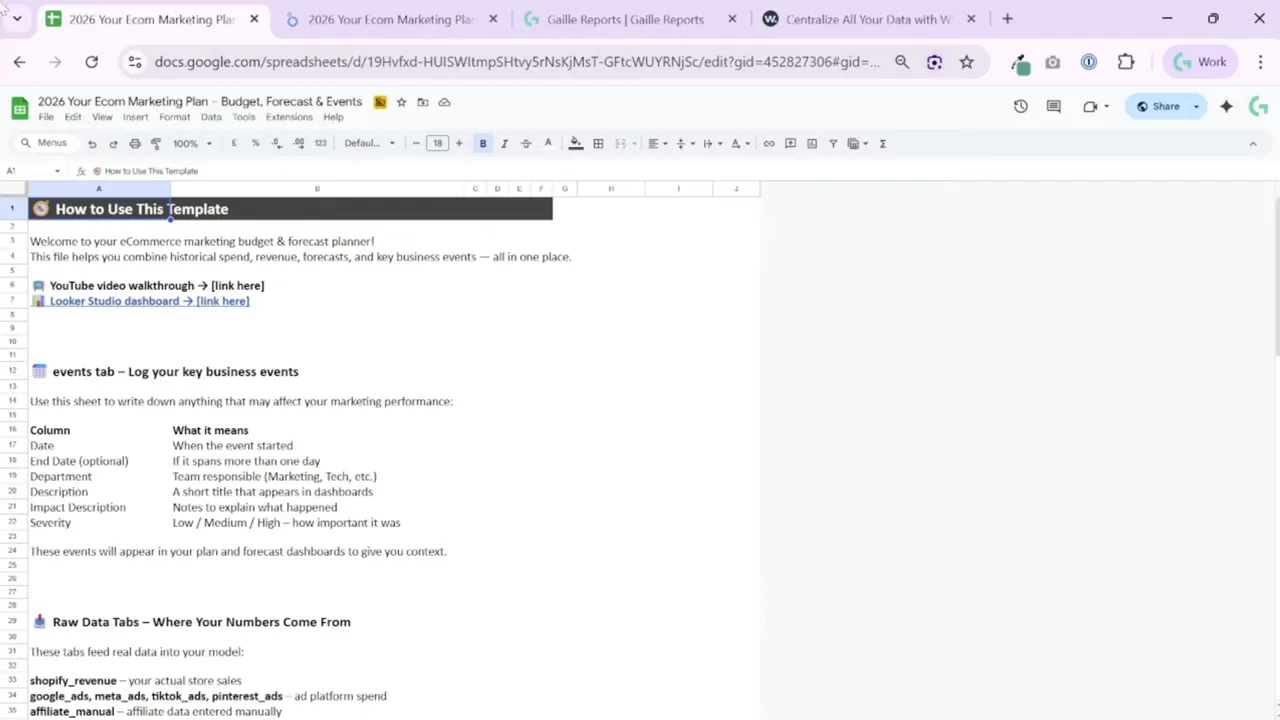
Step 1: Open the planner and understand the layout
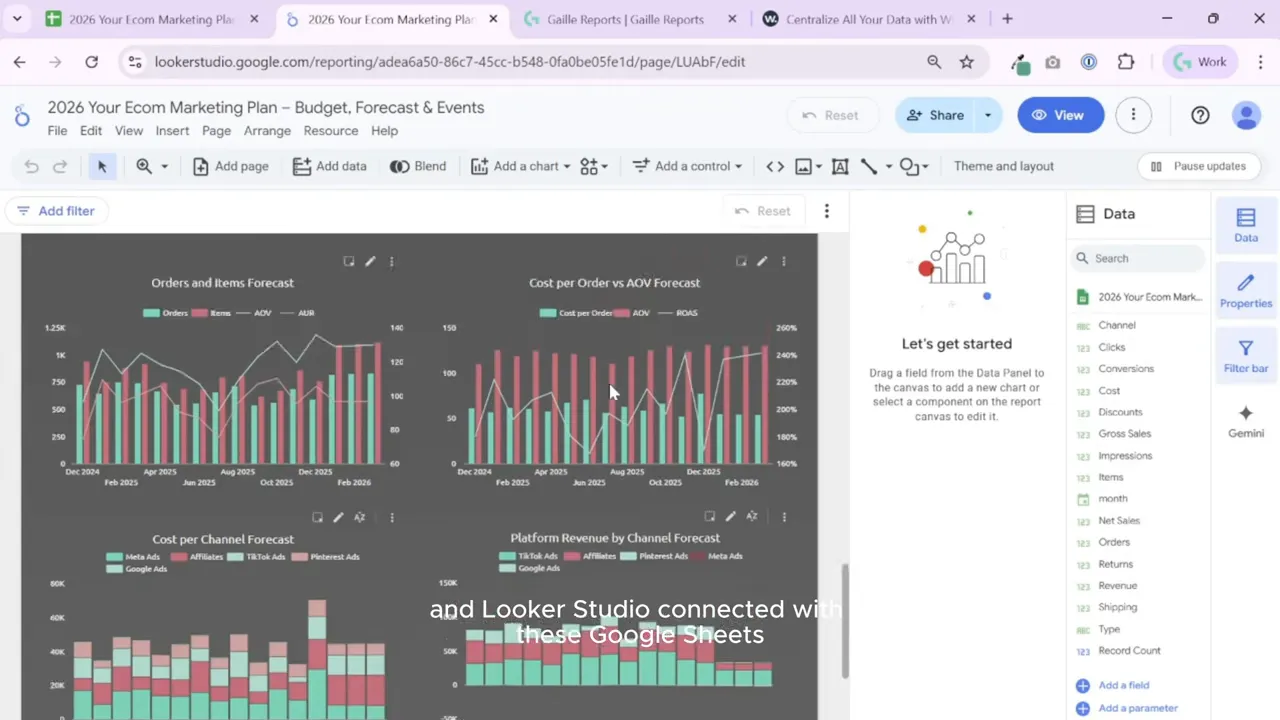
The planner contains two main parts: a Looker Studio report for quick snapshots and a Google Sheets workbook where the real calculation work happens. The Looker Studio page shows net sales, spend versus plan, channel revenue, conversions, and other KPIs in a clean, presentation-ready layout.
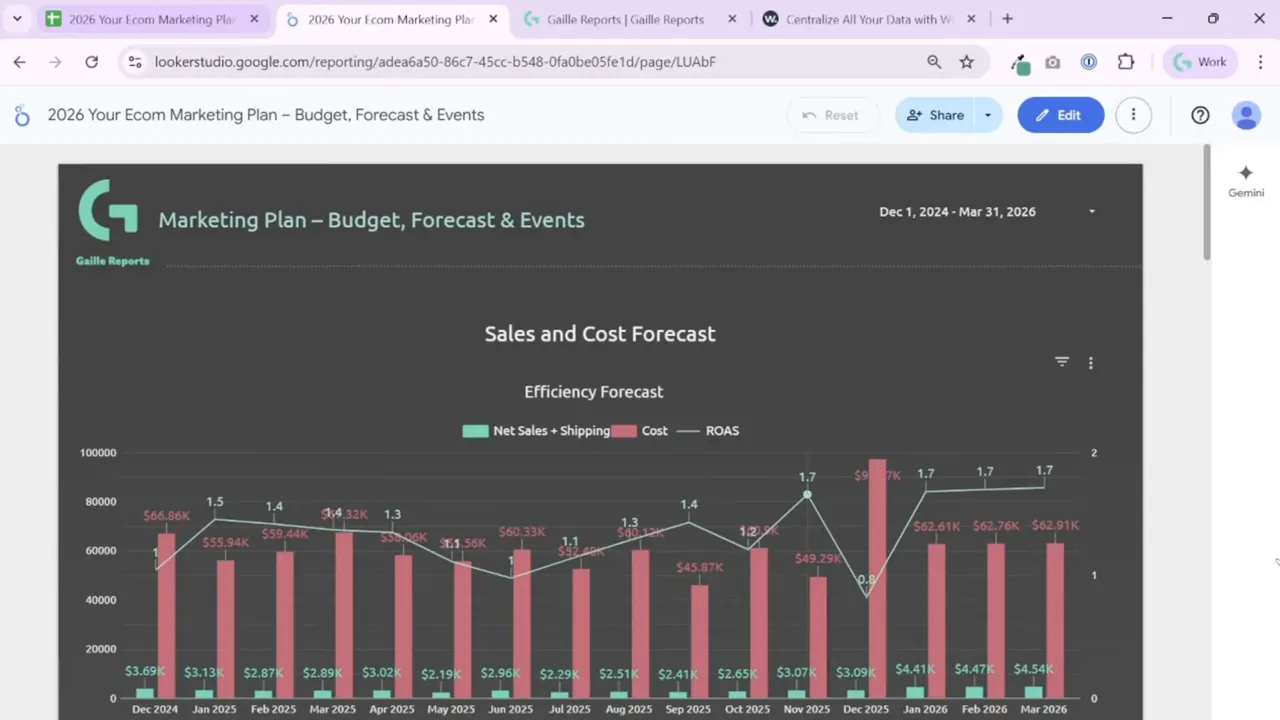
I designed the Looker Studio report to be simple and exportable. Use its PDF export or take screenshots for board slides. The Sheets workbook contains the underlying months, quarters, years, and the formulas that produce forecasts and run rates.
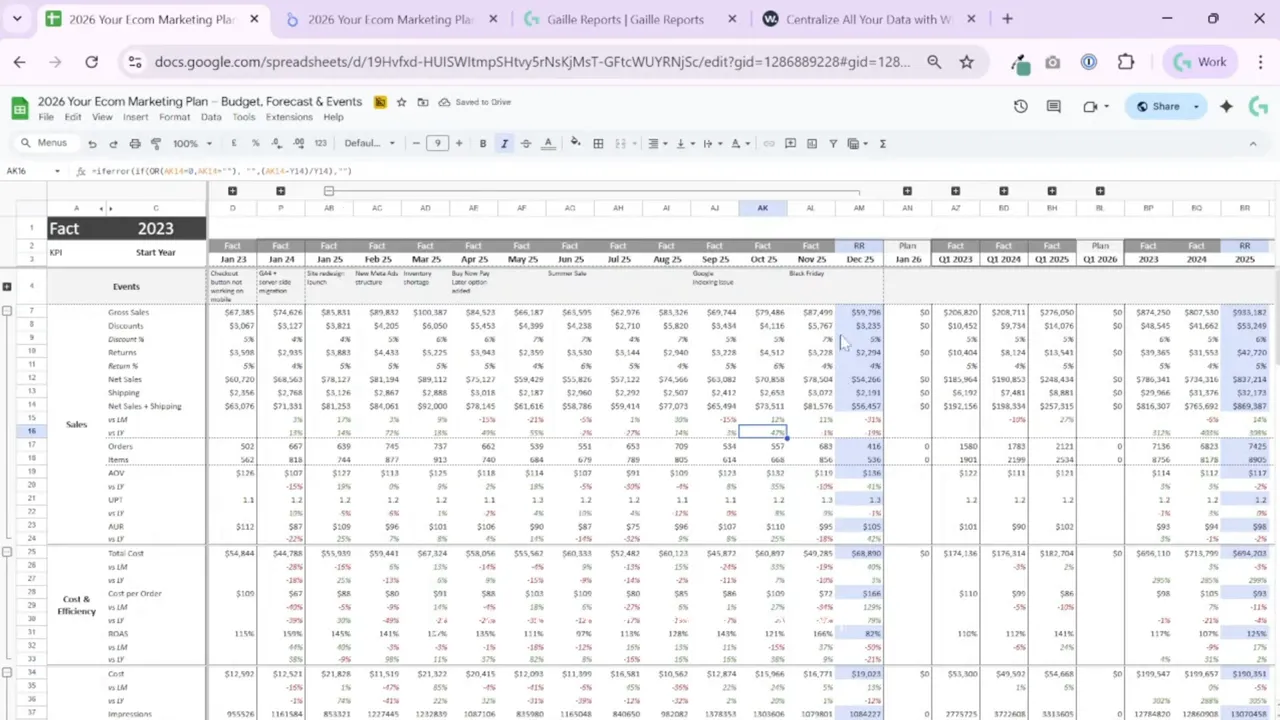
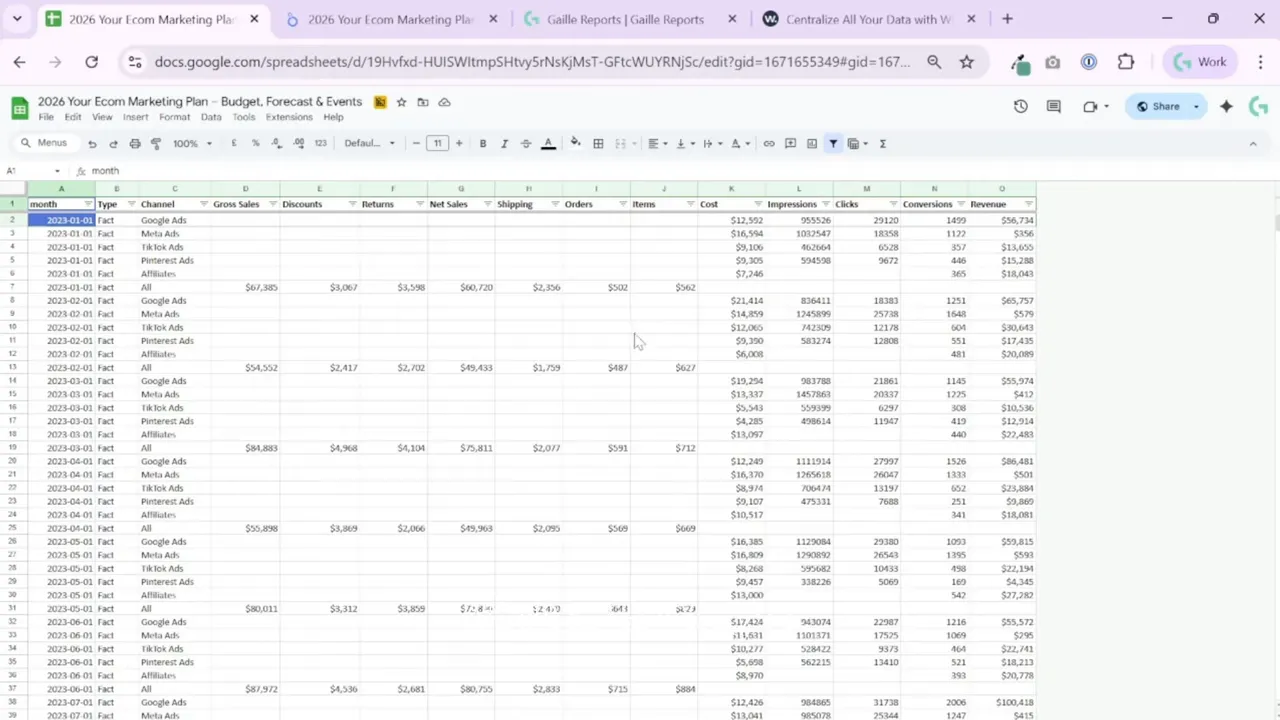
Step 2: Load historical data into the Facts tab
Start by replacing the sample numbers with your real historical data. The Facts tab accepts monthly exports from Shopify or any sales platform and your ad platforms. Keep the column format and order the same so all formulas and Looker Studio connections work smoothly.
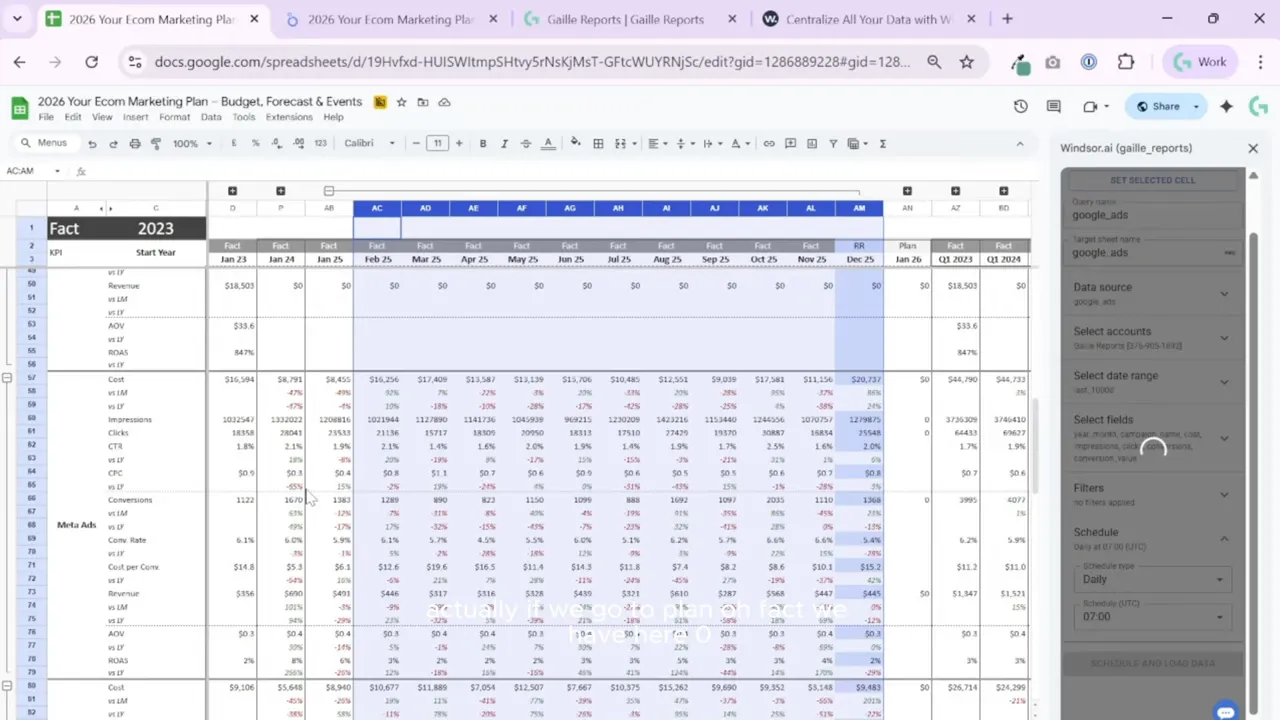
I keep three years of history by default. If you launched later, change the start year and the sheet will adapt the reporting range. The planner colors months to indicate open periods and execution status so you can quickly see what’s real and what’s forecast.
Step 3: Add promo events and annotate driving factors
Use the Events sheet to record major campaigns, product launches, or one-off changes. Add the event gravity and the team or service responsible. These entries appear at the top of the dashboards and act as a reminder why a month behaved differently.
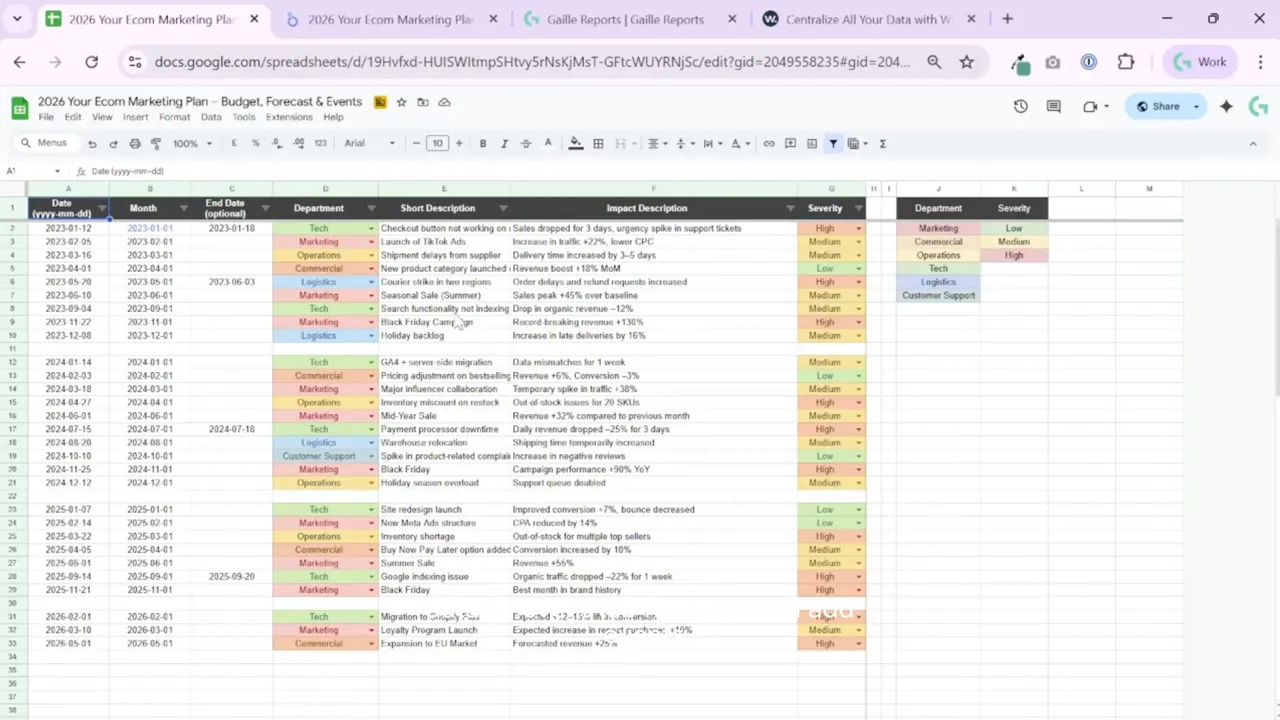
Annotating events makes post-mortems faster and keeps stakeholders aligned on what drove performance.
Step 4: Build the Plan tab with a practical baseline forecast
The Plan tab holds your target numbers for the planning horizon. I use a linear forecasting approach as the default: assume recent trends keep going unless you tell the sheet otherwise. For some metrics I run a simple regression; for others I calculate derived values like discount amounts as a percentage of gross sales.
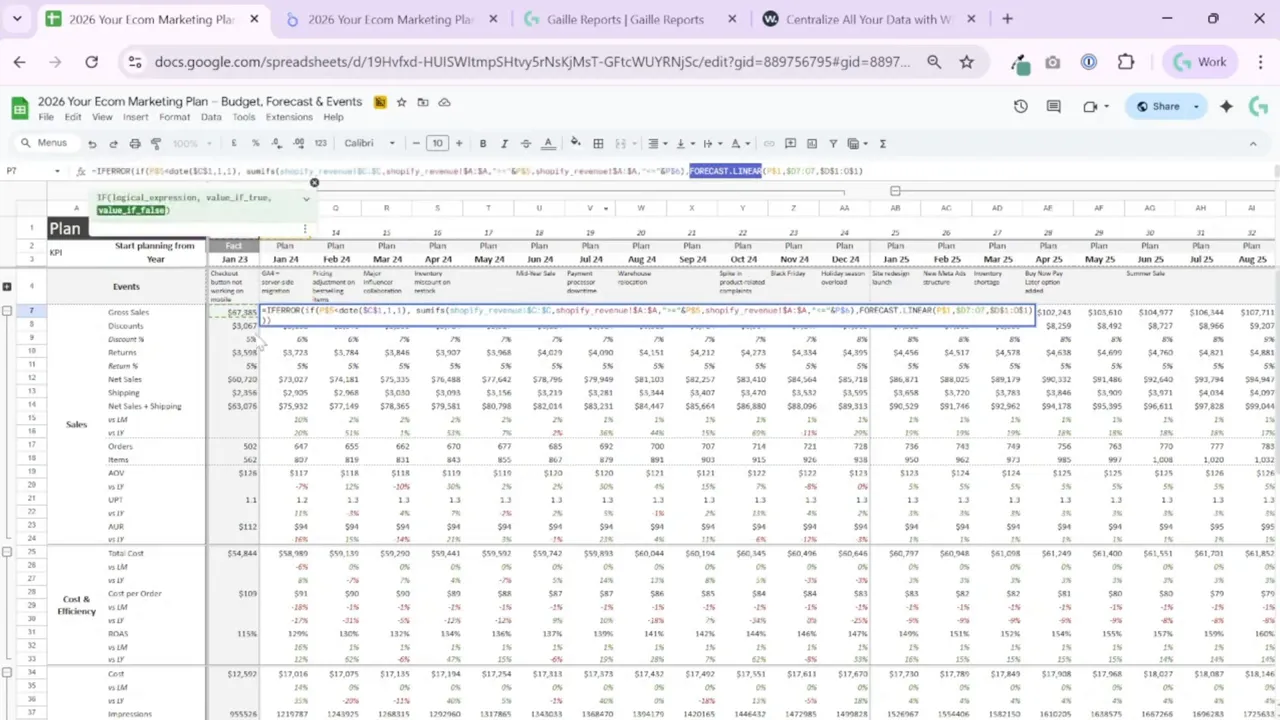
The point is to give you a sensible default you can accept or override manually. If you expect seasonal swings or a big campaign, type in your adjusted monthly sales and spends. The planner lets you mix automated forecasts and manual inputs.
Step 5: Create the Forecast sheet — facts plus plan
The Forecast sheet merges actuals with plan. For periods that have already happened I use recorded facts. For future months the sheet pulls planned values. For the current month the planner calculates a run rate: it divides the month-to-date figure by elapsed days and multiplies by total days in the month to estimate month-end values for both sales and spend.
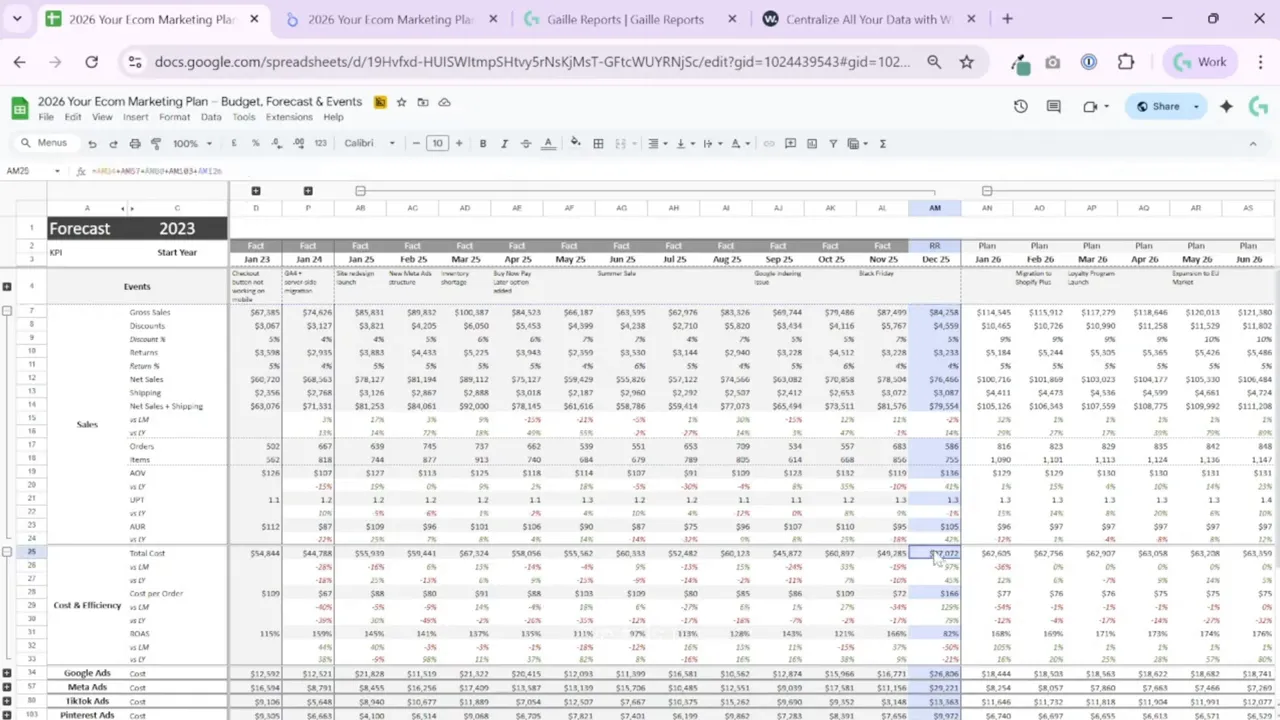
This run-rate method gives realistic short-term forecasts that help you make quick decisions mid-month.
Step 6: Allocate budget by channel using the Mix of Channels tab
The Mix tab lets you allocate and compare budget by channel. Change planned spend per channel and the workbook recalculates totals and variances versus actuals. This sheet works well in conversations with growth teams: you can instantly show how shifting budget from one channel to another changes overall spend and expected returns.
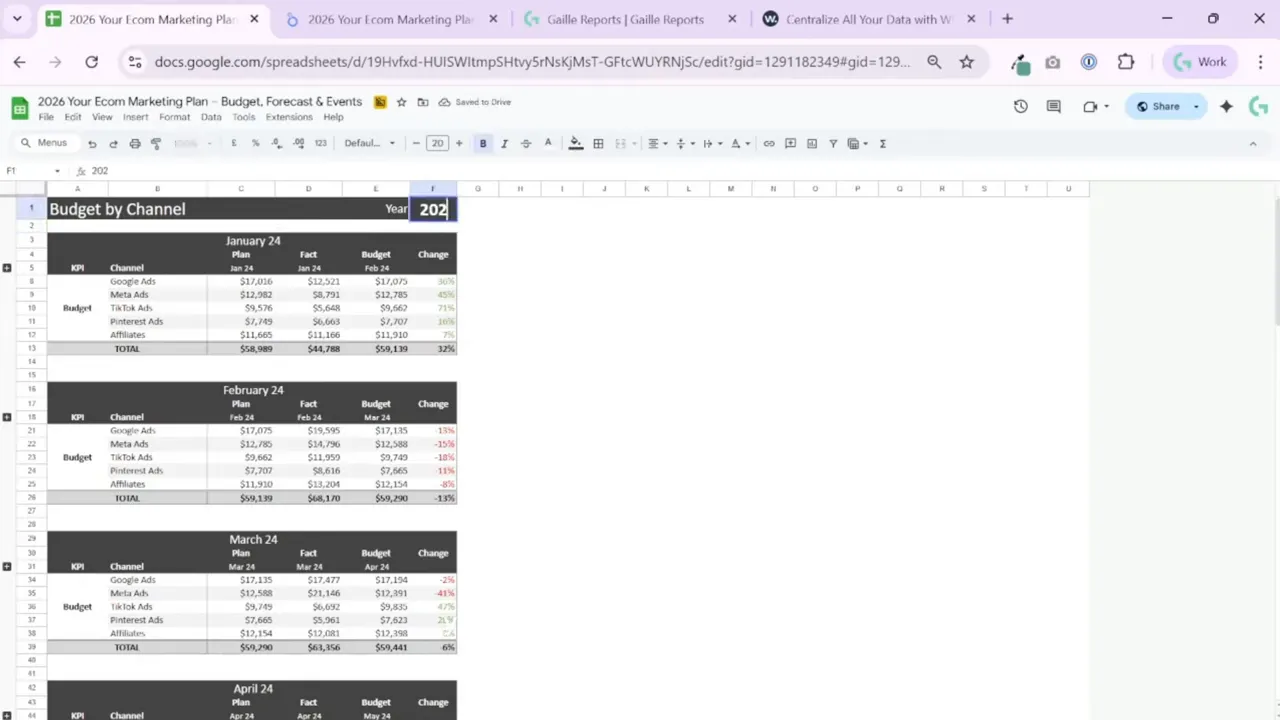
Keep channel-level KPIs in this tab — cost per order, conversions, revenue per channel — so the planner paints a full picture of spend efficiency.
Step 7: Automate data pulls with connectors
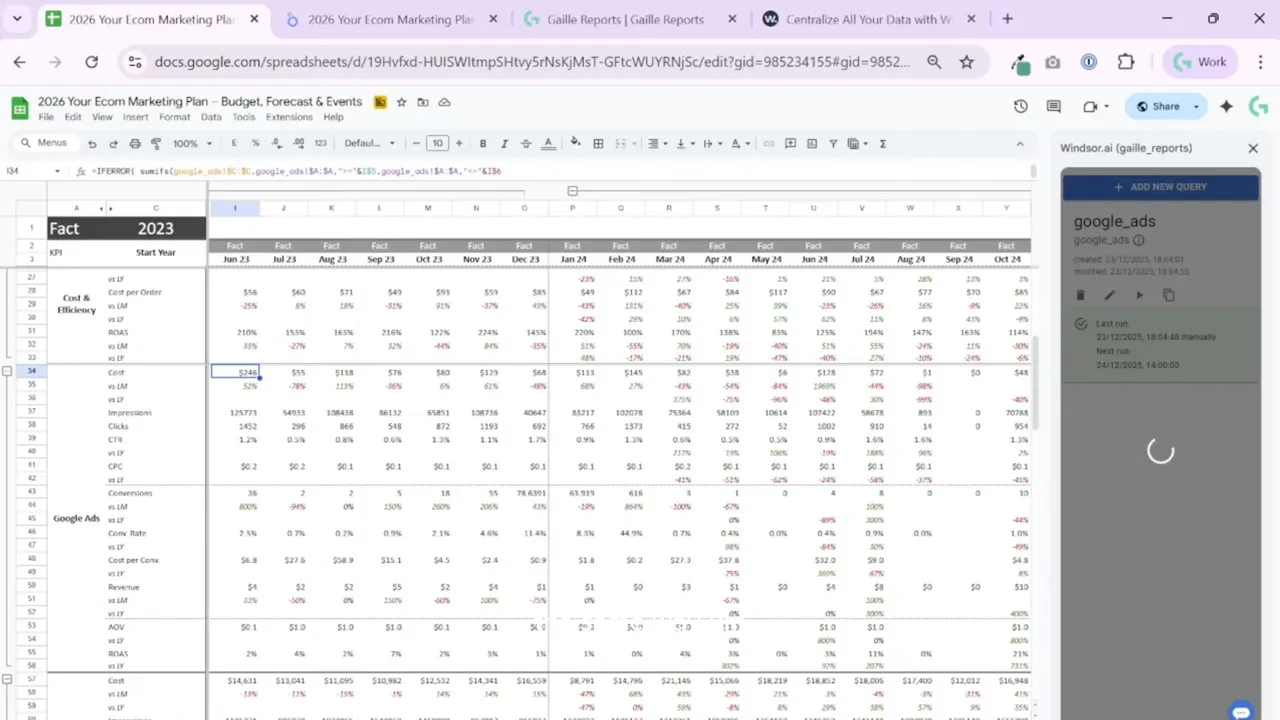
Manual copy-paste works for a start, but the planner shines once you automate. I recommend using connectors like Windsor.ai or Supermetrics to push platform-level data into Google Sheets on a schedule. Set up one query per ad platform and map the fields in the same order the planner expects: year, month, campaign name, impressions, conversions, spend, and so on.
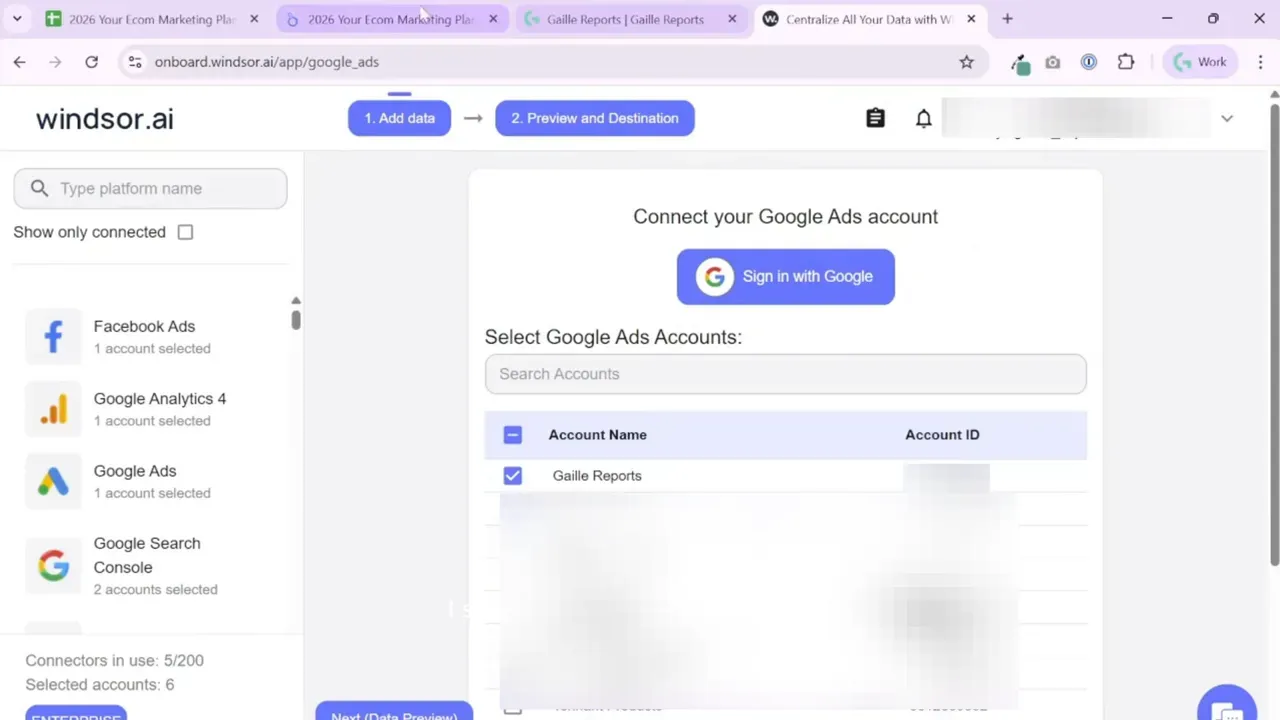
Schedule daily refreshes. Once configured, your Sheets workbook updates automatically and Looker Studio will show fresh numbers every morning. I walk through how I set up a Windsor.ai query step-by-step in the workbook.
Step 8: Use the Expert tab to feed BigQuery or BI tools
The Expert tab normalizes Facts, Plan, and Forecast into a flat table you can connect to BigQuery, Power BI, Tableau, or any other reporting stack. This format makes it trivial to join planner outputs with back-end business metrics and to run further analysis at scale.
Keep this tab unchanged unless you know what you’re doing. Treat it as the canonical export for downstream systems.
Step 9: Validate, present, and iterate
Once data flows in and forecasts look reasonable, export key pages from Looker Studio for presentations. Use the planner’s snapshots to show net sales versus plan, spend by channel, and campaign-level KPIs. If anything looks off, trace it back to the Facts and Plan tabs, adjust events or manual inputs, and regenerate the forecast.
I keep the planner lightweight on purpose. It gives accurate-enough numbers quickly. You can always replace some calculations with more advanced models later, but this structure accelerates decision-making today.
Wrap-up and practical tips
This planner aims to remove friction from budget conversations. It combines:
- Simple, editable forecasts you can override when needed
- Run-rate calculations for realistic month-end estimates
- Channel mix views for clear budget allocation
- Automation-ready layout that works with Windsor.ai and Supermetrics
A few recommendations from my experience:
- Keep the column formats intact when you paste exports into the Facts tabs.
- Use the Events sheet to document anything that moves the needle so future analyses explain anomalies faster.
- Automate data pulls for daily updates, but validate the first few runs manually.
- Start with the planner’s default forecast, then refine it with internal inputs for major campaigns or product changes.
Further reading
For more tutorials and templates on Looker Studio and Google Sheets, check these resources on my site:
Subscribe page with Looker Studio and Google Sheets blog: https://gaillereports.com/subscribe/
Related posts you might find helpful:
Looker Studio Tutorial #12 — How to Build Area Charts
Looker Studio Tutorial #11 — How to Build and Style Pie Charts
Looker Studio Tutorial #10 — How to Build and Style Bar Charts
If you want the template ready to use, I offer the Google Sheets and Looker Studio files pre-connected and updated for 2026. It saves you hours compared with building this from scratch and comes with setup notes for Windsor.ai and Supermetrics.