
BigQuery GA4 Tutorial: Distinguish New and Returning Users Easily

If you’ve ever wondered how to distinguish new users from returning users in your GA4 data within BigQuery, you’re not alone. By default, GA4 exports to BigQuery don’t provide this classification directly, but with a simple timestamp comparison, you can easily define new and returning users on your own. This tutorial will walk you through the steps to do exactly that, helping you unlock deeper insights into your user behavior.
Before we dive in, I invite you to watch the full video tutorial where I demonstrate this process live: Watch the GA4 New vs Returning Users BigQuery Tutorial.
Step 1: Understand the Key GA4 Fields in BigQuery
GA4 exports to BigQuery include detailed event-level data, but two fields are crucial for identifying new versus returning users:
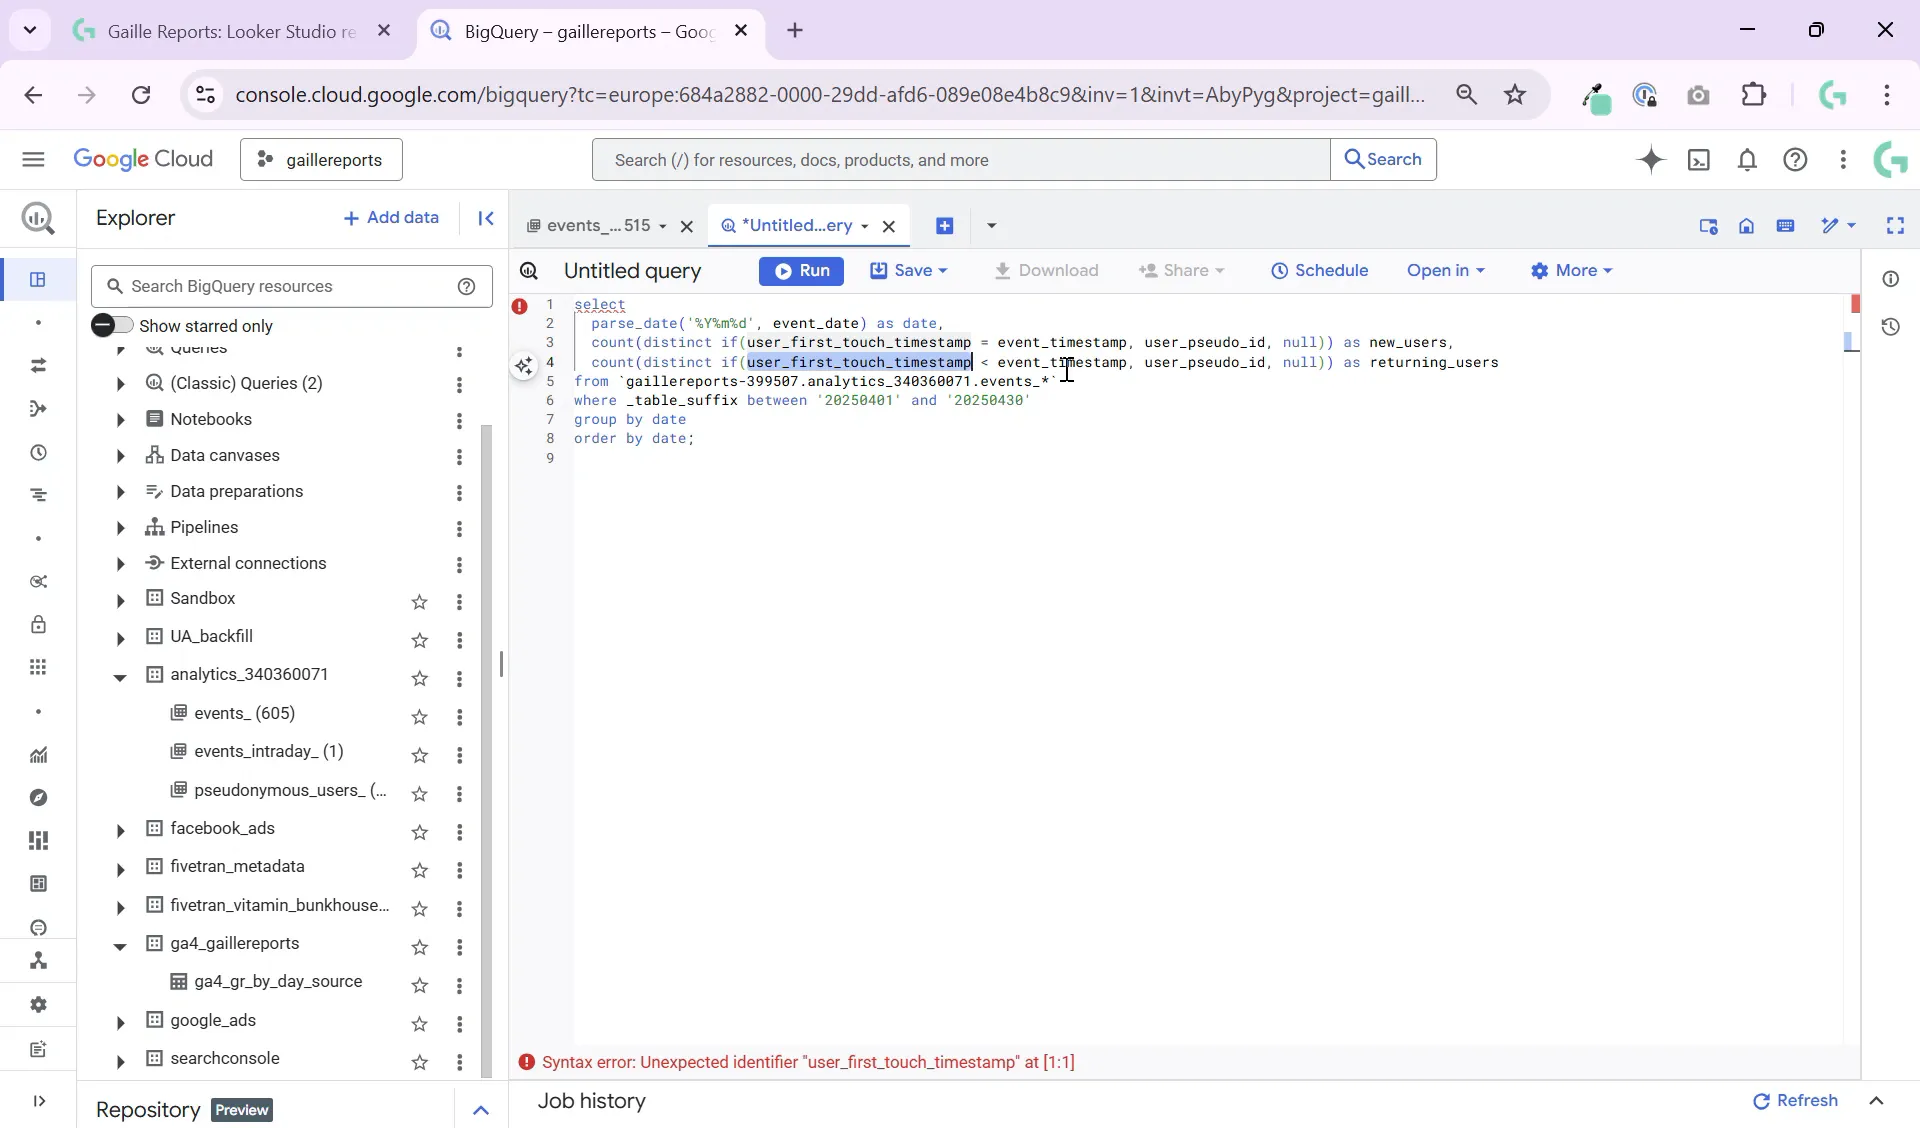
- user_first_touch_timestamp: This timestamp marks the exact moment when a user first visited your website or app. It records the first touch at the millisecond level, providing a unique reference point for each user’s initial interaction.
- event_timestamp: This timestamp records when the current event occurred. Every event in GA4 has its own event timestamp.
By comparing these two timestamps for each user event, you can determine whether a user is new or returning at the time of that event.

Step 2: Writing the Query Logic to Define New and Returning Users
The core logic to differentiate users is straightforward:
- If the
user_first_touch_timestampequals theevent_timestamp, this event belongs to a new user. - If the
user_first_touch_timestampis less than theevent_timestamp, this event belongs to a returning user.
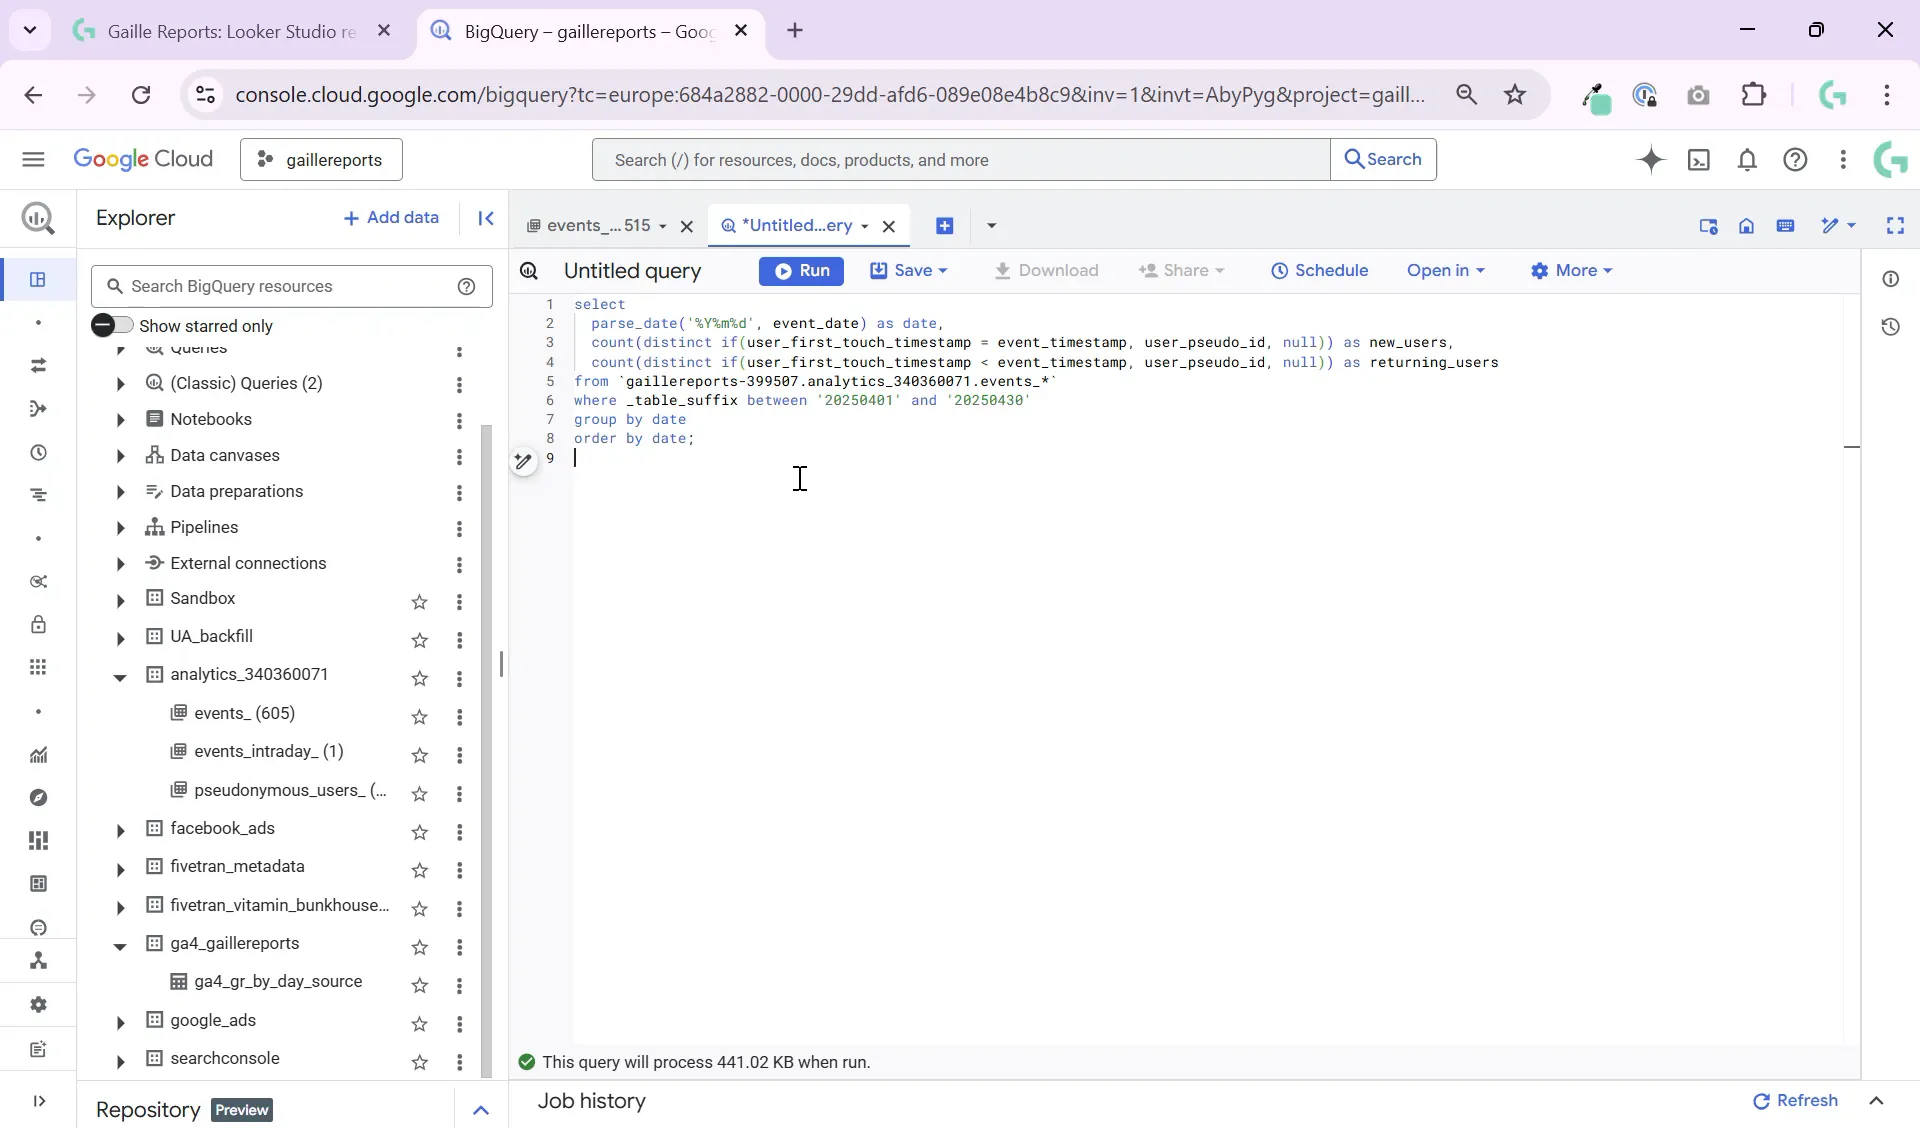
In SQL terms, you will compare these timestamps and count distinct user IDs accordingly.
Here is an example snippet:
SELECT
  COUNT(DISTINCT user_pseudo_id) AS new_users
FROM
  `your_project.your_dataset.events_*`
WHERE
  user_first_touch_timestamp = event_timestamp
And similarly, for returning users:
SELECT
  COUNT(DISTINCT user_pseudo_id) AS returning_users
FROM
  `your_project.your_dataset.events_*`
WHERE
  user_first_touch_timestamp > event_timestamp
This logic works because the first touch timestamp is fixed per user, representing their first visit, while the event timestamp changes with each event logged.
Step 3: Integrate This Logic Into Larger Queries
Once you understand the basic condition, you can merge this logic into more complex queries to analyze sessions, traffic sources, conversions, and other dimensions alongside your new vs returning user counts.
For example, you might want to join this with session data to see how new and returning users behave differently during their visits or analyze traffic sources to understand where your returning users come from.

Using this approach, you can build custom dashboards and reports that provide richer insights than what GA4’s default interface offers.
Step 4: Tips for Working with GA4 Data in BigQuery
- Use DISTINCT counts: Always count distinct
user_pseudo_idoruser_idto avoid double counting users. - Leverage timestamps: Timestamp comparisons are key to segmenting users over time.
- Combine with session and traffic source data: Enrich your user classification by joining with session tables or source/medium information.
- Optimize queries: Use partitioned tables where possible and filter with date ranges to improve performance.
Step 5: Further Resources and Learning
If you want to deepen your understanding of working with GA4 data in BigQuery, here are some of my other tutorials that complement this topic:
- How to Connect BigQuery to Looker Studio: Beginner-Friendly Tutorial – Learn how to visualize your GA4 data and other datasets with Looker Studio.
- Google Sheets to BigQuery Made Easy: No Coding Required – Integrate spreadsheet data with your BigQuery analytics for richer reports.
- How to Query GA4 Data in BigQuery Using _TABLE_SUFFIX: Full Tutorial – Master querying GA4’s daily partitioned tables efficiently.
Wrapping Up: Unlocking New vs Returning Users Insights in BigQuery
With just a simple condition comparing user_first_touch_timestamp and event_timestamp, you can easily segment your GA4 users into new and returning categories within BigQuery. This empowers you to create custom, flexible reports that go beyond GA4’s default interface limitations.
This method is super easy to implement and can be integrated into larger SQL queries to analyze sessions, conversions, and traffic sources by user type. Understanding your new versus returning user dynamics helps tailor marketing strategies and improve user retention efforts.
Remember, the key is mastering these timestamps and leveraging distinct user counts. Once you get comfortable with this approach, you’ll unlock a whole new level of marketing analytics power using BigQuery and GA4 data.
For hands-on practice and a detailed walkthrough, don’t forget to watch the video tutorial here: GA4 New vs Returning Users BigQuery Tutorial.
Feel free to leave a comment or question if you want me to cover other BigQuery or GA4 analytics topics next. Happy querying!