
What’s New in the Looker Studio Update
Google’s recent update to Looker Studio introduces modern chart styles that help improve the visual quality and usability of dashboards. In this article, we’ll look at what changed, how to enable these new styles, and how they affect bar, pie, and time series charts. This guide is based on hands-on testing using a GA4 demo account.
Looker Studio Modern Charts Explained – What’s New & How to Use
The update applies to several chart types including bar charts, pie charts, and time series charts. These new styles offer a cleaner, more modern look and allow for better customization.
Video Overview:
How to Enable Modern Styles
To switch to the new chart styles:
- Go to Theme and Layout in your Looker Studio report.
- Click “Enable” under modern chart styles.
- Important: once enabled, you can’t go back to classic styles. It’s best to duplicate your report first.
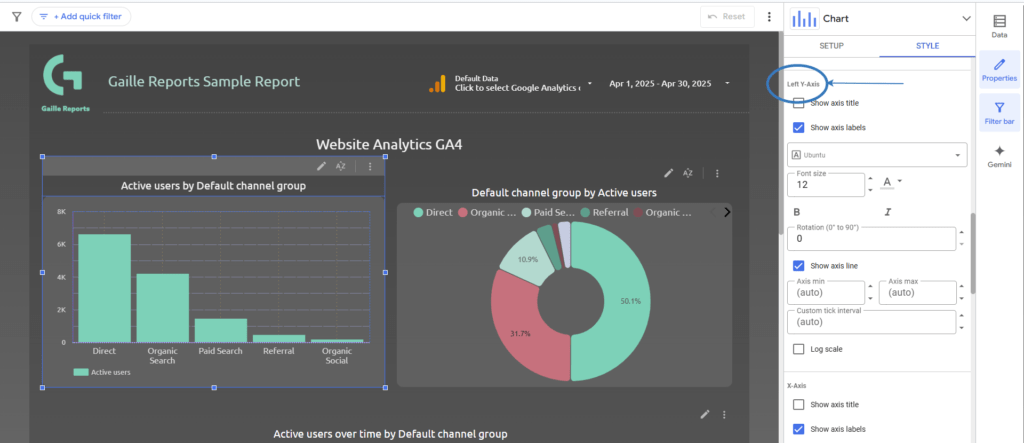
Changes in Bar Charts
After enabling the update, one of the first things you’ll notice is the expanded styling options for bar charts:
- You can now change the axis title and label colors independently.
- Font size, bold styling, and even label rotation are now available.
- You can show or hide axis titles and labels.
- Grid lines can now be adjusted separately for horizontal and vertical axes.
These features give much more control and flexibility when designing charts, especially when you want to remove clutter or emphasize specific data points.
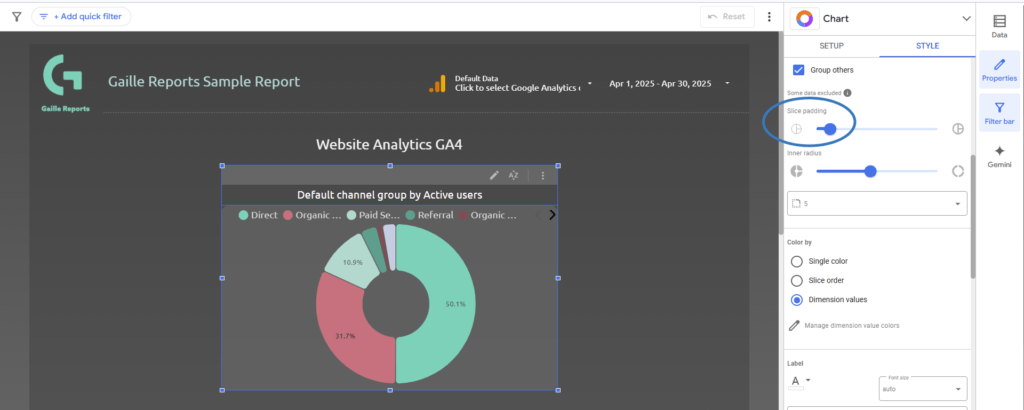
Changes in Pie Charts
In pie charts, the new styles offer:
- Slice padding: adds space between chart segments.
- Rounded corners: visually useful if your dashboard has a softer design theme.
- The only drawback I noticed is that the legend sits too close to the chart and can’t be freely repositioned to the side — only top or bottom.
Despite this, I personally like the slice padding and rounded corners. They make the charts look more stylish.
Changes in Time Series Charts
Time series charts now include:
- Gradient fills: not always necessary, but they might match your site’s style.
- Line weight adjustments.
- All the useful things like cumulative lines, trend lines, and reference lines remain.
- More axis and label settings, similar to the bar chart updates.
Personally, I’m not sure I’ll use gradient fills often, but it’s good to have the option. And I really like that now we can fully control grid lines and axis display.

Final Thoughts
This Looker Studio update brings very welcome improvements. Some features are small visual tweaks, while others—like better axis control and grid line customization—are a big help in real dashboards. I’ll definitely use these features in my work.
Want to dive deeper into Looker Studio?
If you’re exploring more advanced use cases, here are two articles you might find helpful:
- Blended Data in Looker Studio: Join Types. The Full Tutorial – Learn how to combine multiple data sources and understand how different join types affect your results.
- Shopify Connectors for Looker Studio – A practical overview of how to connect your Shopify store to Looker Studio and visualize key e-commerce metrics.