
Blended Data in Looker Studio: Join Types. The Full Tutorial

Data blending is a process in which you mix information from different data tables to make one set of data. In this article I’m going to give you the full image about the blended data join types in Looker Studio.
Check out the a full video tutorial:
Content
What is data blending?
Data blending is a process in which you mix information from different data tables to make one set of data. This process is also known as join in SQL.
There are various types of blended data joins available in Looker Studio:
- Left outer join – we take a data from the left table as a base and add data from the right table based on the rows from left table
- Right outer join – we take a data from the right table as a base and add data from the left table based on the rows from right table
- Inner join – only data that was found in both of the tables.
- Full outer join – all data from both tables
- Cross join – when we show for each row of a table 1 all the rows from the table 2
Pre-setup
Basically, I’ve prepared two tables – one with data from Google Ads and the other one with data from Facebook Ads.

Table 1

Table 2
About the tables:
- We have such columns as Platform, Data, Campaign, Cost, Impressions, Clicks and Conversions.
- As you can see, the dates in two tables are different – in table 1 we have 27.05, 26.05, 25.05, and in table 2 – 27.05, 25.05, 24.05, 23.05.
Moving to Looker Studio. We need to connect each of the tables as data sources. You can do it by clicking “Add data” in the menu. One more important setting is when you have the rows overview, you need to pay attention to the data formats and change the format of the Cost to Euro (or your currency).

Let’s create two tables with Facebook Ads and Google Ads data sets.

These tables serve just to represent what data we are going to show in the dashboard.
Now, let’s move to joins!
Data Blending – types of joins
To add a blend, you can use two ways:
- Click “Resources” in the upper menu → Manage Blends → “Add a Blend”
- Select a table when you want to blend data → In the right settings panel, under the data source, click “Add a Blend”
It will lead you to the same data blend setting menu.
Using data blending in Looker Studio can save you a plenty of time whereas you will need to put much more effort in Google Sheets.
Left Outer Join
A Looker Studio Left Outer Join returns all rows from the left table and the matching rows from the right table to perform blended data. If there is no match in the right table, NULL values will be returned for the right table columns.
How does it work in practice?
Having selected a table with Google Ads (it will be our left table), let’s explore the data blend menu.

As I’ve mentioned above, to make a data blend, both of the tables need to have rows in common. In our case, as the ads platforms and campaigns are different, we will blend data based on dates.
Then we add our second table – the one with Facebook Ads data. Automatically, Looker Studio will add both metrics and dimensions to dimensions. So, using drag-and-drop you can easily move all the necessary metrics to the corresponding field.
In fact, you can add up to 5 data sources to the blend. In our case we have just two.
Finally, to finish our blending, we need to add a join. Click the “Configure join” button.
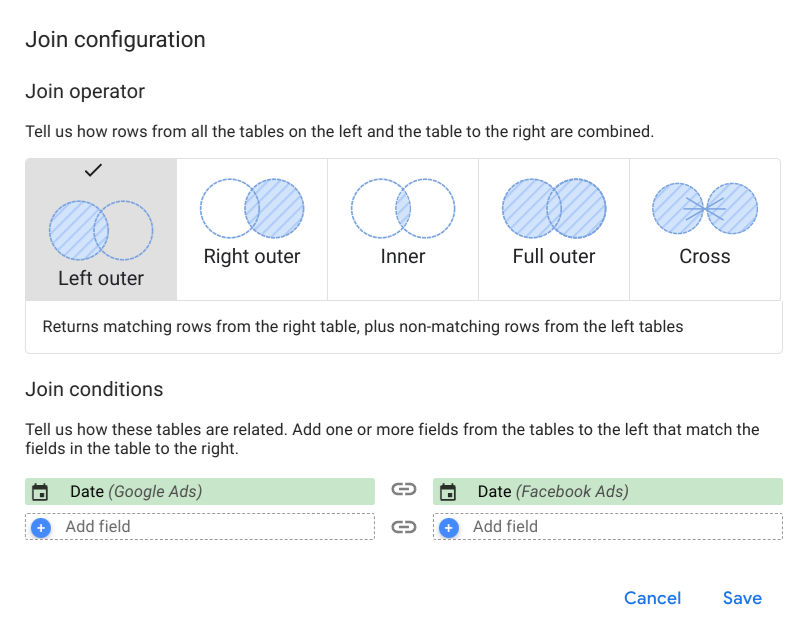
Here we see all the possible types of joins and types of conditions. Now we need to select the Left outer join and select “Date” as a join condition (the field in common). Meaning, we will only see the data from the dates matching in both of the tables.

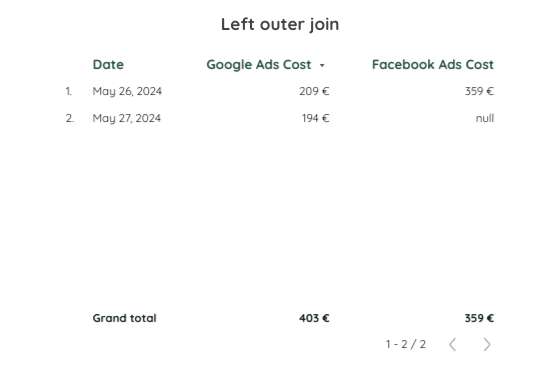
This is what final settings and a final table look like just for you to see.
Right outer join
In a right outer join, if a value exists in the right data source but not the left data source, the left data source will return a null value. Conversely, if a value exists in the left table but not the right table, it will be dropped since the focus is on the right table.
To create the right outer join, copy the existing table and rename it. You can edit the table’s data sourceable by clicking “Edit” → “Data Source” and choose Google Ads as a default table once again. In the Date Range Dimensions select Data, in the Dimension – Date, and remove one of the Cost columns. Click Blend Data, and name the table the same way it was done to the left table. Check all the filters and change the name of the Cost fill to Google Ads Cost etc. We now go on to join the table, select Facebook Ads, and rename the table, in the metrics we choose Cost and rename it to Facebook Ads Cost etc.

Now we add configuration. By Default Locker Studio offers us Date as a connection field. What we change is Left Outer to Right Outer and click save. Now we change the Data Source name on the right and save. Now we add Facebook Ads Cost to the Metrics.

Final table is going to look like this:

Inner join
Inner join is an interesting and time-saving join type. It returns only rows that satisfy the join condition from both tables, meaning non-matching rows from both tables will be dropped. This can be helpful when you only care about the values that can be enriched and do not want to include any missing or null values.
To create the inner join table we copy the right join and rename the table. In the Data Source, we once again select Google Ads, Date as a Dimension and Cost for Metric. Click Blend Data, name the table Google Ads, rename Metric and connect the Facebook Ads table. Pick Cost as a Metric and rename it.
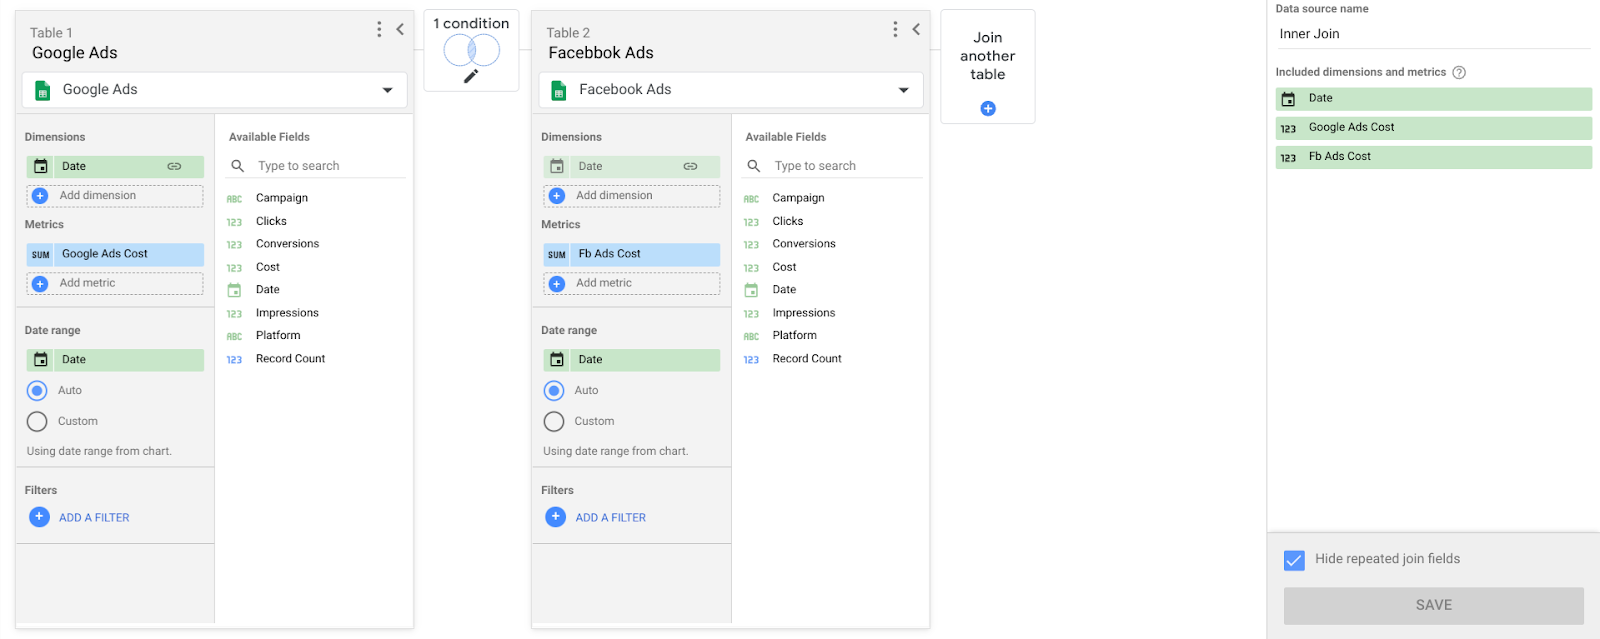
In the configuration setting, we now select Inner Join and save. Rename the Data Source and save it again. In this table, you will see less data than in previous ones, because we have only two common dates.

In the end, you can see the final table here:

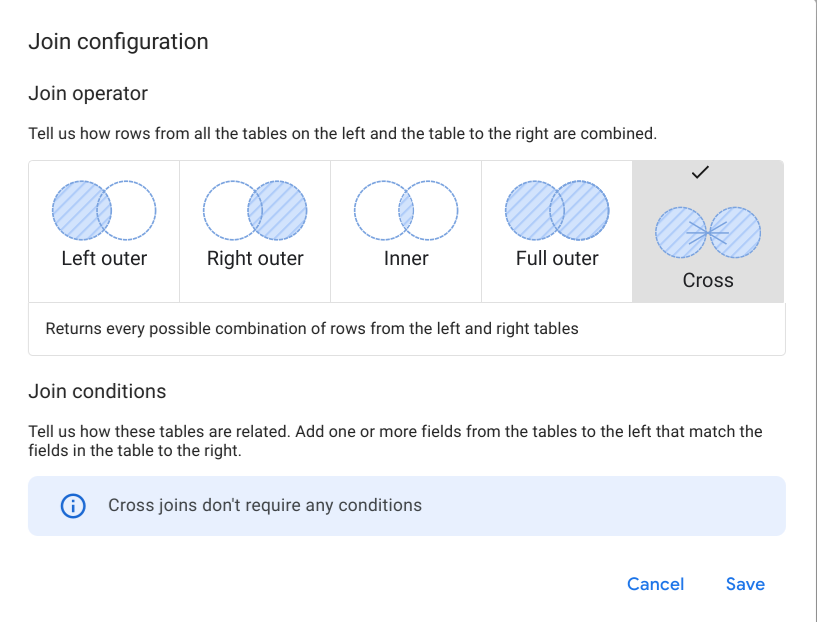
Cross join
In essence, a cross join returns every possible combination of rows from the left and right tables. This is different from a full outer join, which only returns all the rows.
The cross join can be created from the previous tables in the same way we did before. After selecting Google Ads as Data Source and Date as Dimension, we go to Blend and name the table, rename the Cost and join Facebook Ads. We choose Cost as Metric and rename it. We select Date as a Data range.
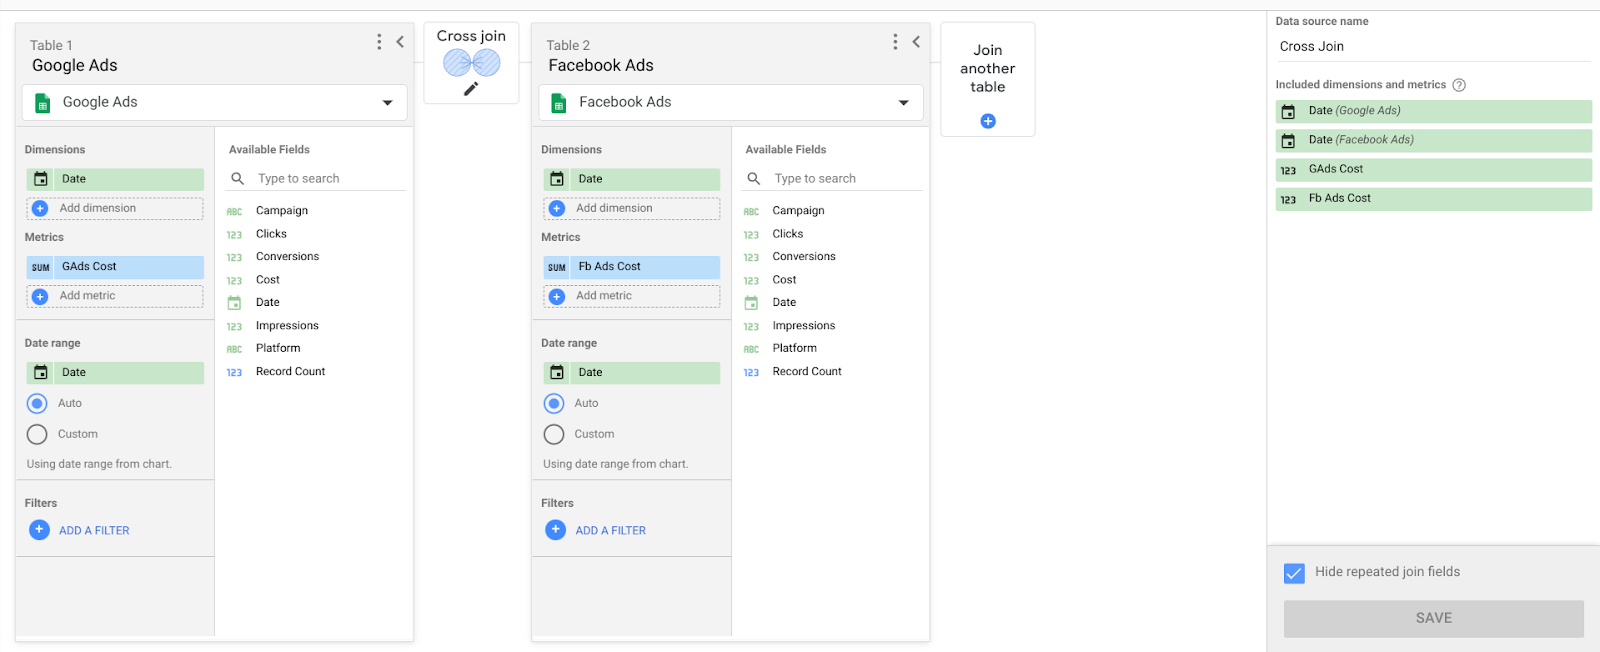
After that, we choose Cross Join in the Configuration and save. Rename the Data Source and save it again. You add the Date for Facebook Ads to Dimension as well as the Cost to Metric.
This is how the final table has to look like:

Full Outer Join
Full Outer Join will work the opposite way of Inner Join. While an inner join drops any non-matching rows, a full outer join keeps everything, even if they don’t match. In a full outer join, you don’t want to lose any data, and for anything that cannot be matched, a null value will be returned.
You can copy the Inner Join table and rename it to Full Outer Join. Let’s use the Google Ads table that we’ve used in the very beginning as a base.
We need to remain the tables, select date and platform as dimensions for each of them. Having selected Cost as a metric, let’s name them Google Ads Cost and Facebook Ads Cost respectively to the tables.

Then we move to Join Configuration. We select Full Outer Join as a join type and, similarly to the previous join types, we set up Date as a join condition.

And this is the table we get. You can go back to compare this table with original Google Ads and Facebook Ads tables. As you may notice, the grand total for each ads platform is the same.

Let’s add two additional columns:
- Date in Common
We can do it easily, just by adding a new dimension field with a formula:
IFNULL(Date (Google Ads),Date (Facebook Ads))
- Cost
This formula will help us to see the total cost per each day. For this, add a new metric, change the format to Currency (in our case, Euro) and write this custom formula:
sum(IFNULL(Google Ads Cost,0))+sum(IFNULL(Facebook Ads Cost,0))
Basically, if there is no data from any of the ads platforms on a certain day, we will 0 instead of it. Then we will sum up costs from both ads platforms.

Summary
This was a quick but detailed overview of all the blended data join types in Looker Studio.
You’ve learnt about:
- Left outer join — Returns all rows from the left table plus matching rows from the right tables.
- Right join — Returns all rows from the right table plus matching rows from the left tables.
- Inner join — Returns only matching rows from the left and right tables.
- Full outer join — Returns all matching rows from the left or the right table.
- Cross join — Returns every possible combination of rows from the left and right tables.
In Gaille Reports template store we have a Google Ads + Facebook Ads report template. This report is built based on Windsor.ai connector. Owing to this connector, you will save a plenty of time because all the necessary blended data processes in Looker Studio are set up. You just have to upload your data and enjoy the results!
Check out the Google Ads + Facebook Ads report template here.
Hope you liked this article, share your impressions in the comments section!