BigQuery GA4 Tutorial: How to Get Daily Users and Sessions with SQL

If you’ve just started working with Google Analytics 4 (GA4) data in BigQuery, you might be wondering how to extract key metrics like daily active users and sessions. This tutorial will guide you step-by-step through writing SQL queries to analyze your GA4 data in BigQuery, helping you transform raw data into actionable insights.
For a complete walkthrough, feel free to watch the full video tutorial here: BigQuery for GA4 – How to Get Daily Users and Sessions (Beginner Tutorial).
Step 1: Understanding Your GA4 Data Structure in BigQuery
Before diving into queries, it’s important to understand how GA4 exports data to BigQuery. GA4 stores events in a nested structure, with each event representing an interaction on your website or app. These events are saved in daily tables under a dataset, often named something like events_YYYYMMDD.
When querying multiple days, you’ll use a wildcard table reference with an asterisk (*) to cover a range of dates. For example, to query data from May 1st to May 12th, you would use the table suffix filter:
FROM `your_project.your_dataset.events_*`
WHERE _TABLE_SUFFIX BETWEEN '20230501' AND '20230512'
This method allows you to pull data across multiple days efficiently.
Step 2: Counting Daily Active Users
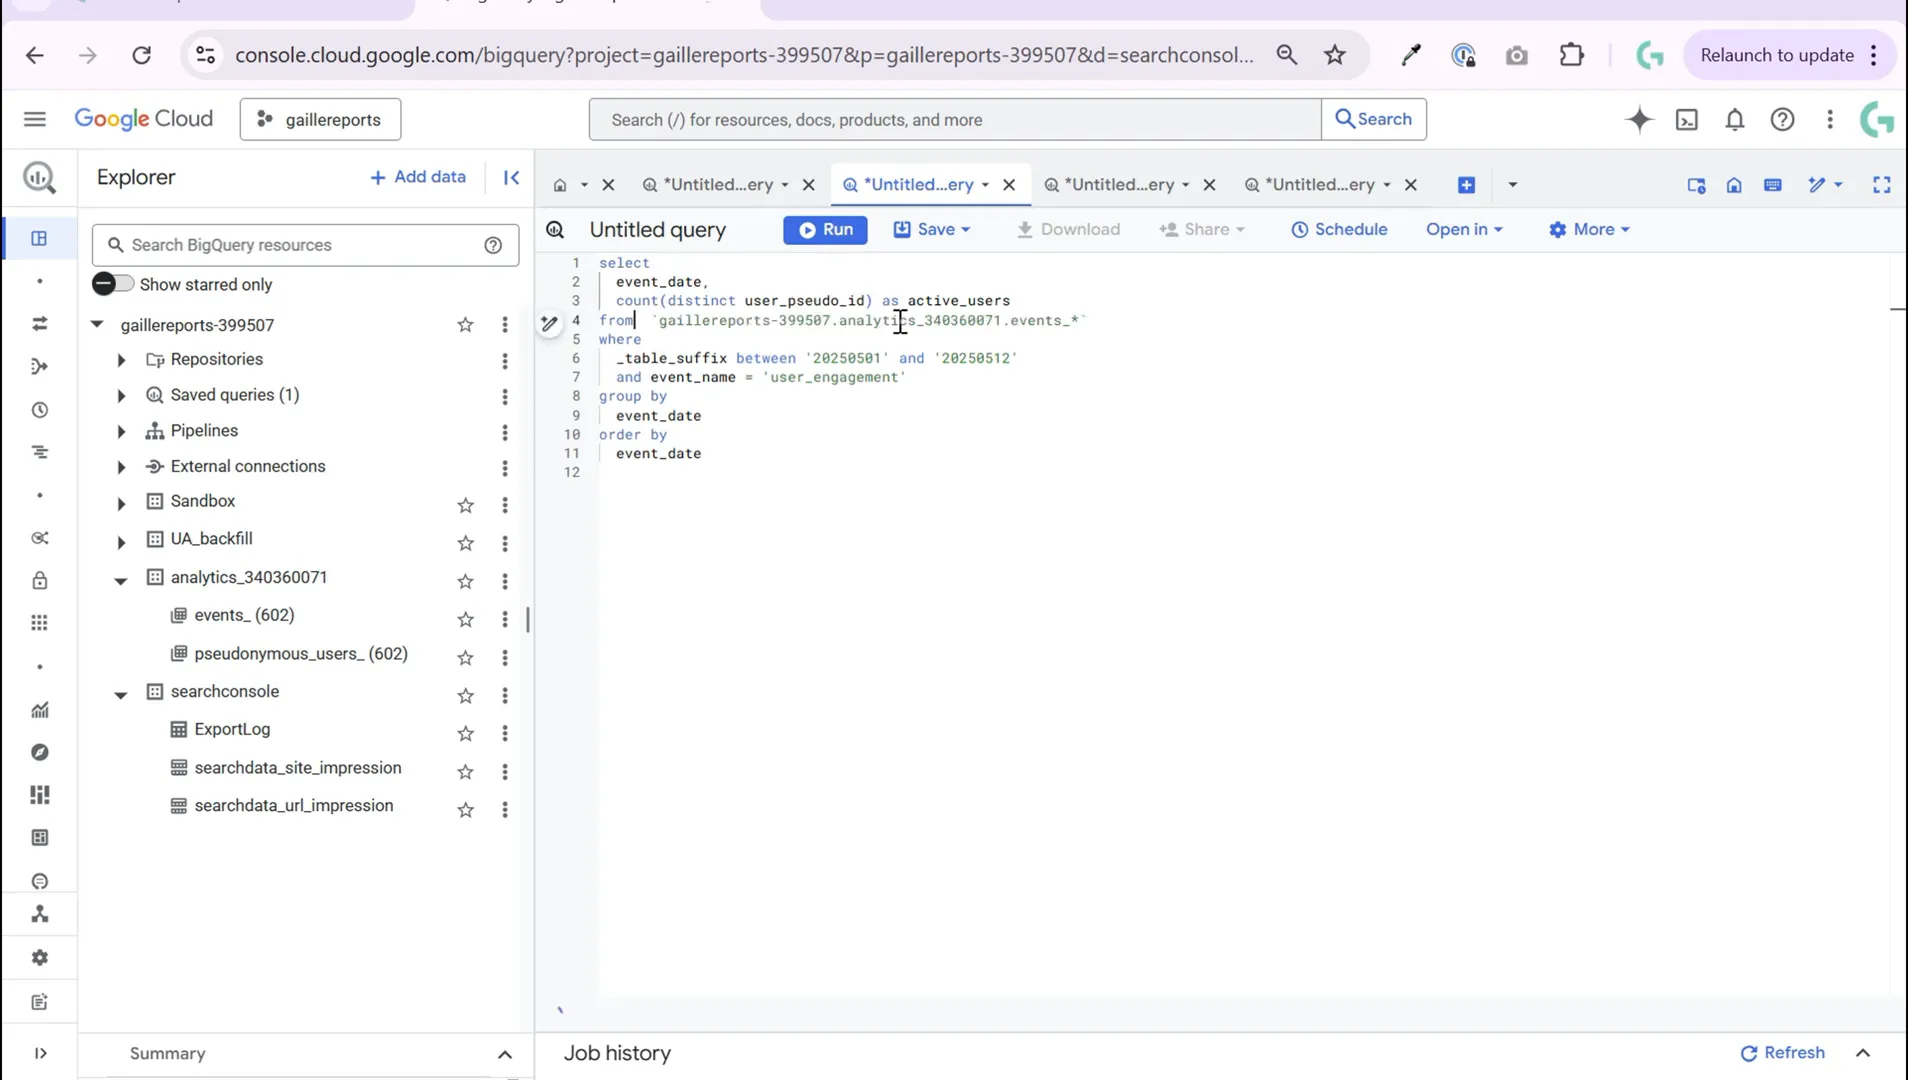
Active users are those who have engaged with your website or app on a particular day. GA4 tracks engagement using the event user_engagement. To count daily active users, you want to identify unique users who triggered this event on each day.
Here’s a simplified query to count active users by day:
SELECT
  event_date,
  COUNT(DISTINCT user_pseudo_id) AS active_users
FROM
  `your_project.your_dataset.events_*`
WHERE
  _TABLE_SUFFIX BETWEEN '20230501' AND '20230512'
  AND event_name = 'user_engagement'
GROUP BY
  event_date
ORDER BY
  event_date
In this query:
- event_date is used to group data by day.
- user_pseudo_id is an anonymized unique identifier for each user.
- COUNT(DISTINCT user_pseudo_id) counts unique users who triggered the
user_engagementevent.
Running this query will give you the number of active users for each day in your selected date range.
Step 3: Counting Total Users and Comparing with Active Users
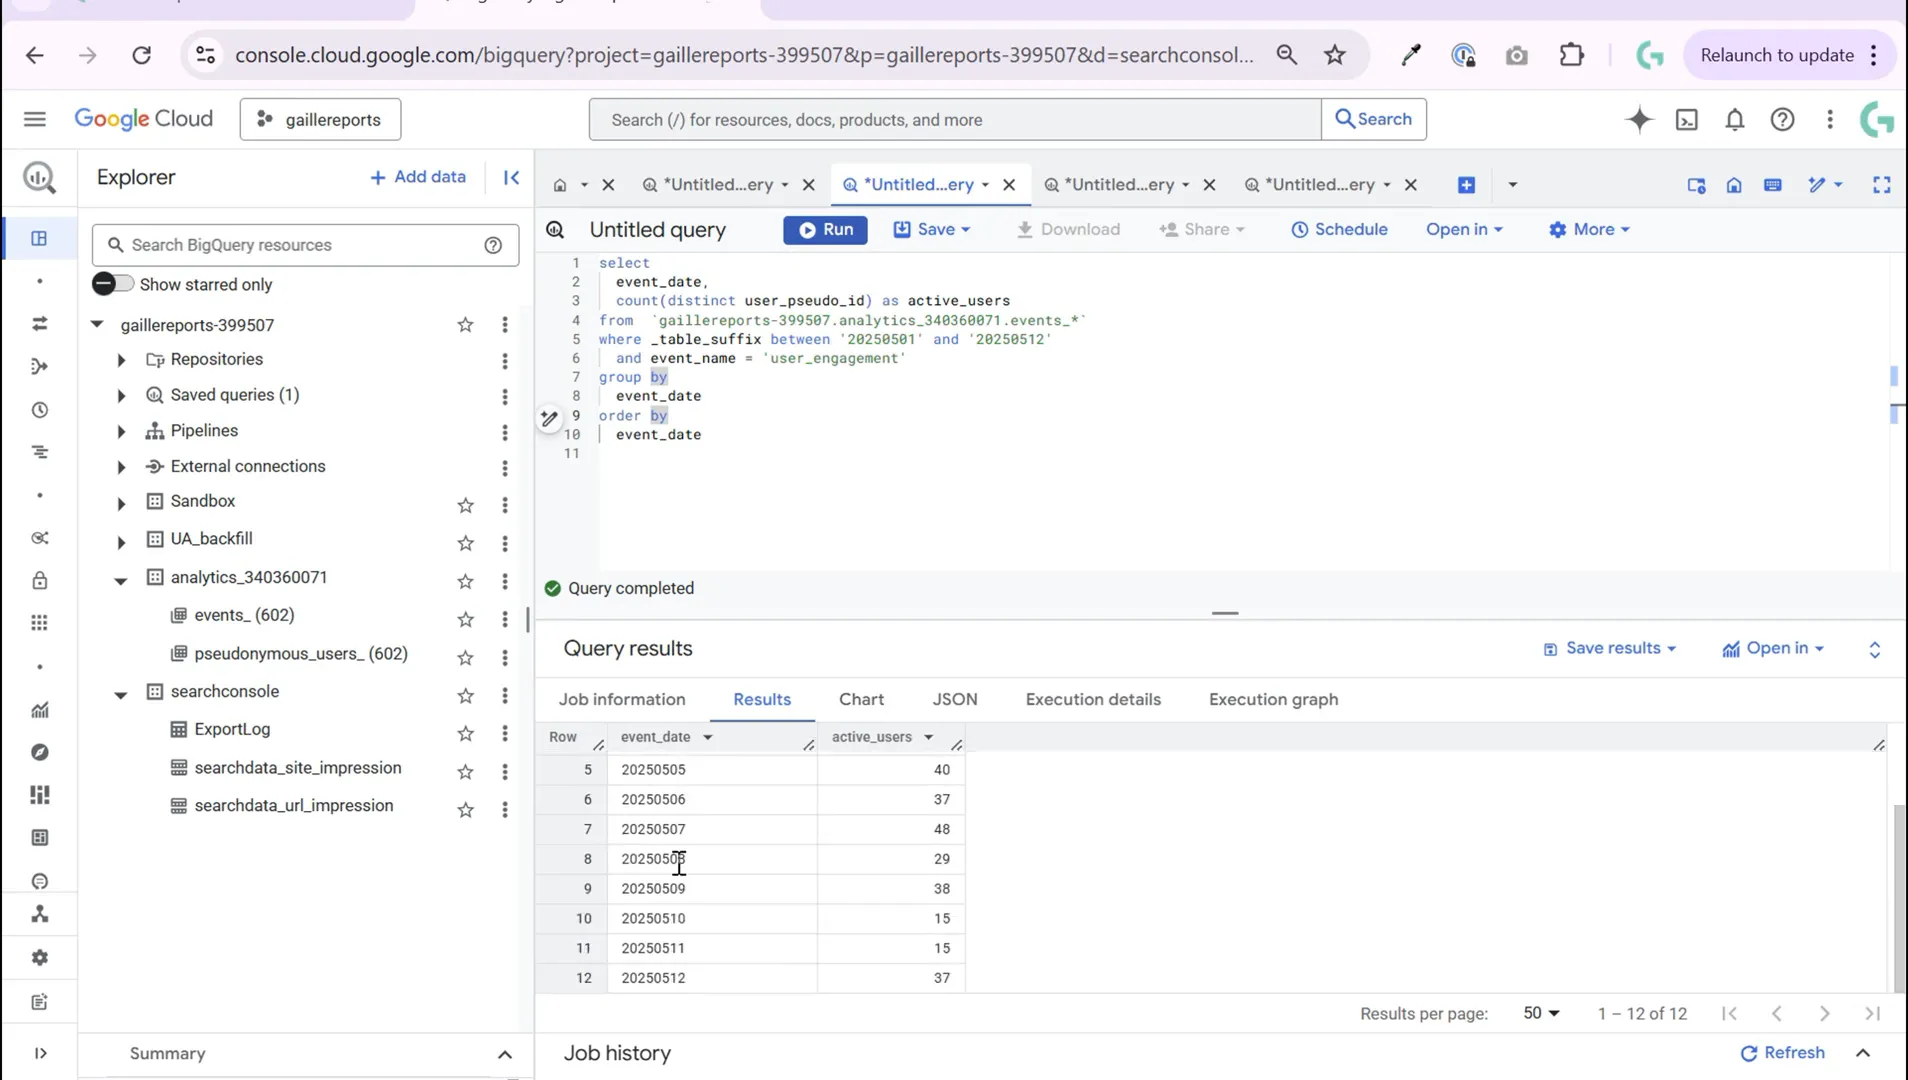
What if you want to see not just active users, but total users who triggered any event on each day? This requires a slightly more complex query because you need to count all unique users regardless of event type, while still identifying which users were active (engaged).
To do this, you can move the event name condition from the WHERE clause to a conditional count inside the SELECT statement. Here’s how:
SELECT
  event_date,
  COUNT(DISTINCT user_pseudo_id) AS total_users,
  COUNT(DISTINCT IF(event_name = 'user_engagement', user_pseudo_id, NULL)) AS active_users
FROM
  `your_project.your_dataset.events_*`
WHERE
  _TABLE_SUFFIX BETWEEN '20230501' AND '20230512'
GROUP BY
  event_date
ORDER BY
  event_date
Explanation:
- total_users: counts all unique users in the date range.
- active_users: counts unique users who triggered the
user_engagementevent using theIFfunction.
This approach allows you to see both metrics side-by-side, showing how many users were active versus how many users were present in total.
Step 4: Parsing Dates Correctly and Counting Sessions
One thing to watch out for is that the event_date field in GA4 BigQuery export is stored as an integer in the format YYYYMMDD, not as a date type. To work with dates properly in your reports, you should convert this integer into a date format using BigQuery’s PARSE_DATE function.
Here’s how you can convert the integer event_date into a date:
PARSE_DATE('%Y%m%d', CAST(event_date AS STRING)) AS parsed_event_date
This converts the event date from an integer like 20230501 to a proper DATE type like 2023-05-01, which you can use in your visualizations or further calculations.
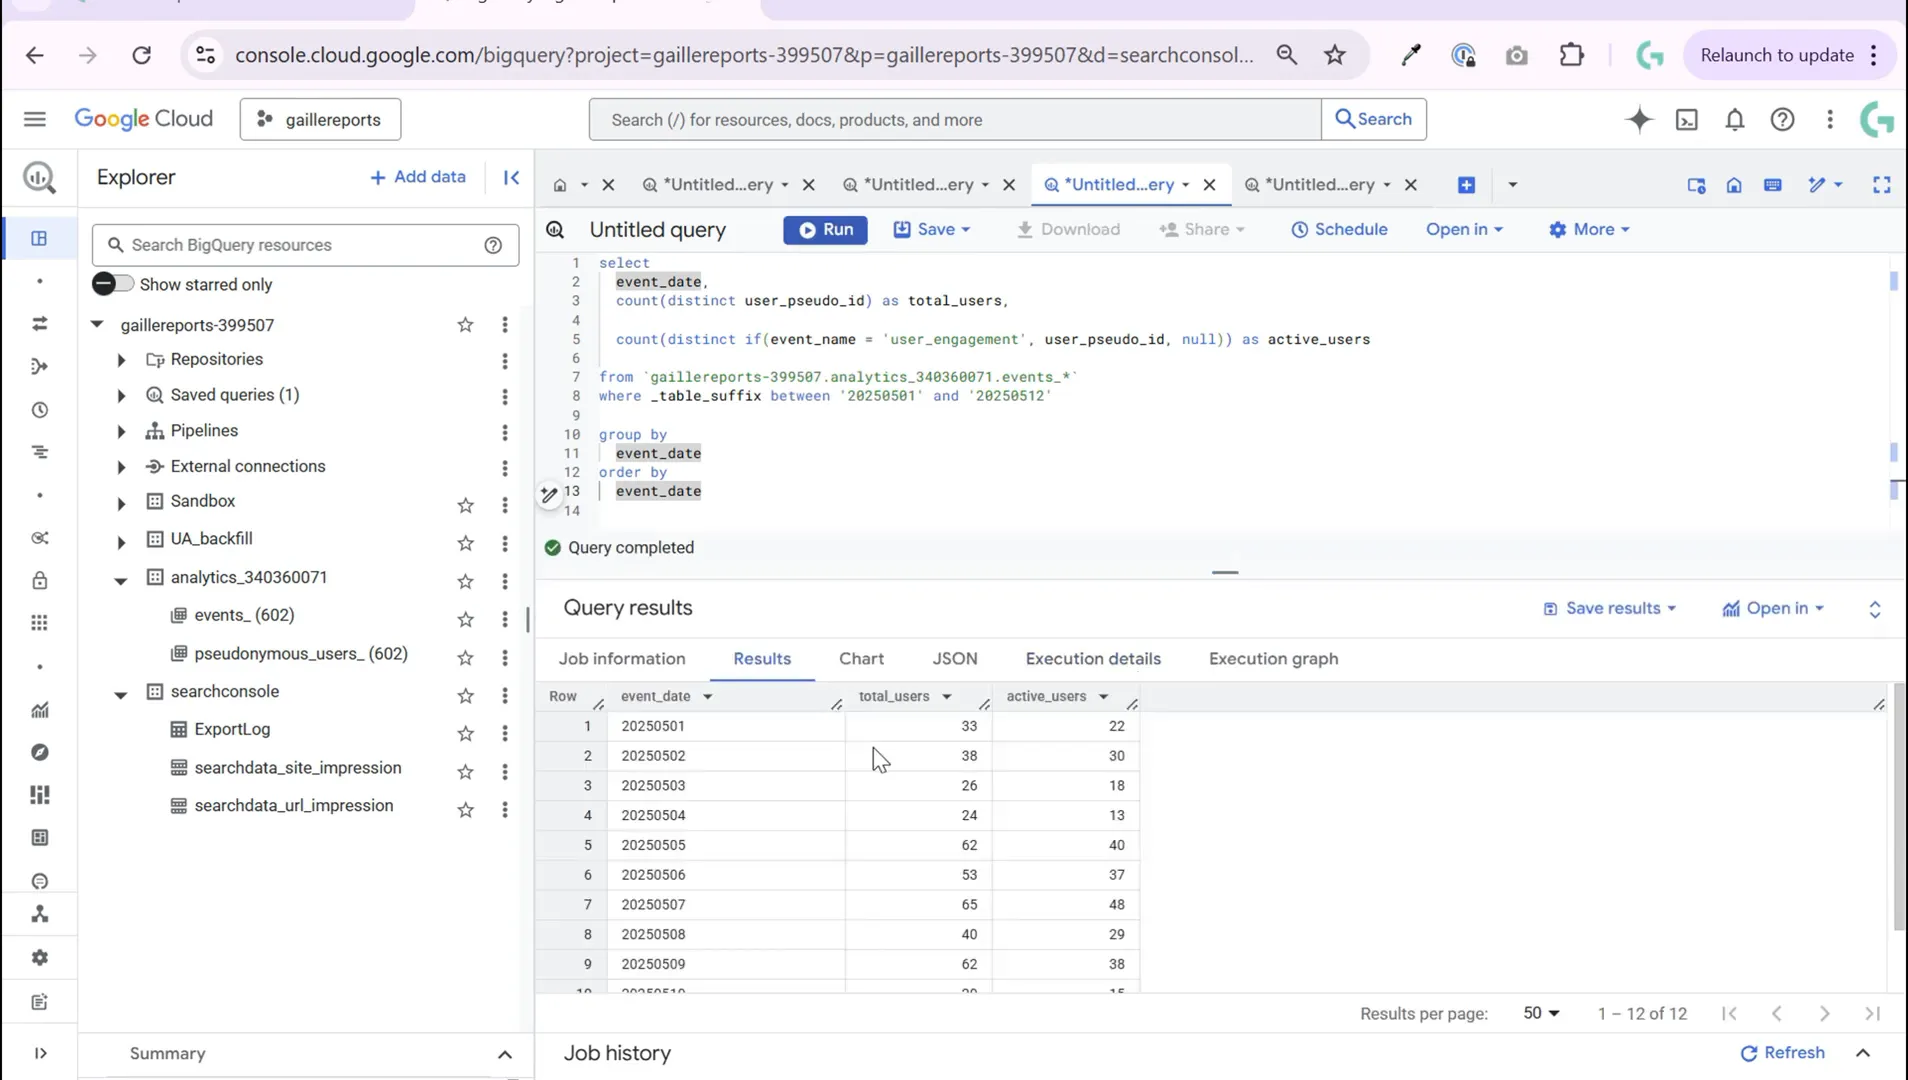
Next, let’s count sessions. Sessions in GA4 are tracked using the session_start event. Unlike users, one user can have multiple sessions, so you count the number of session_start events per day.
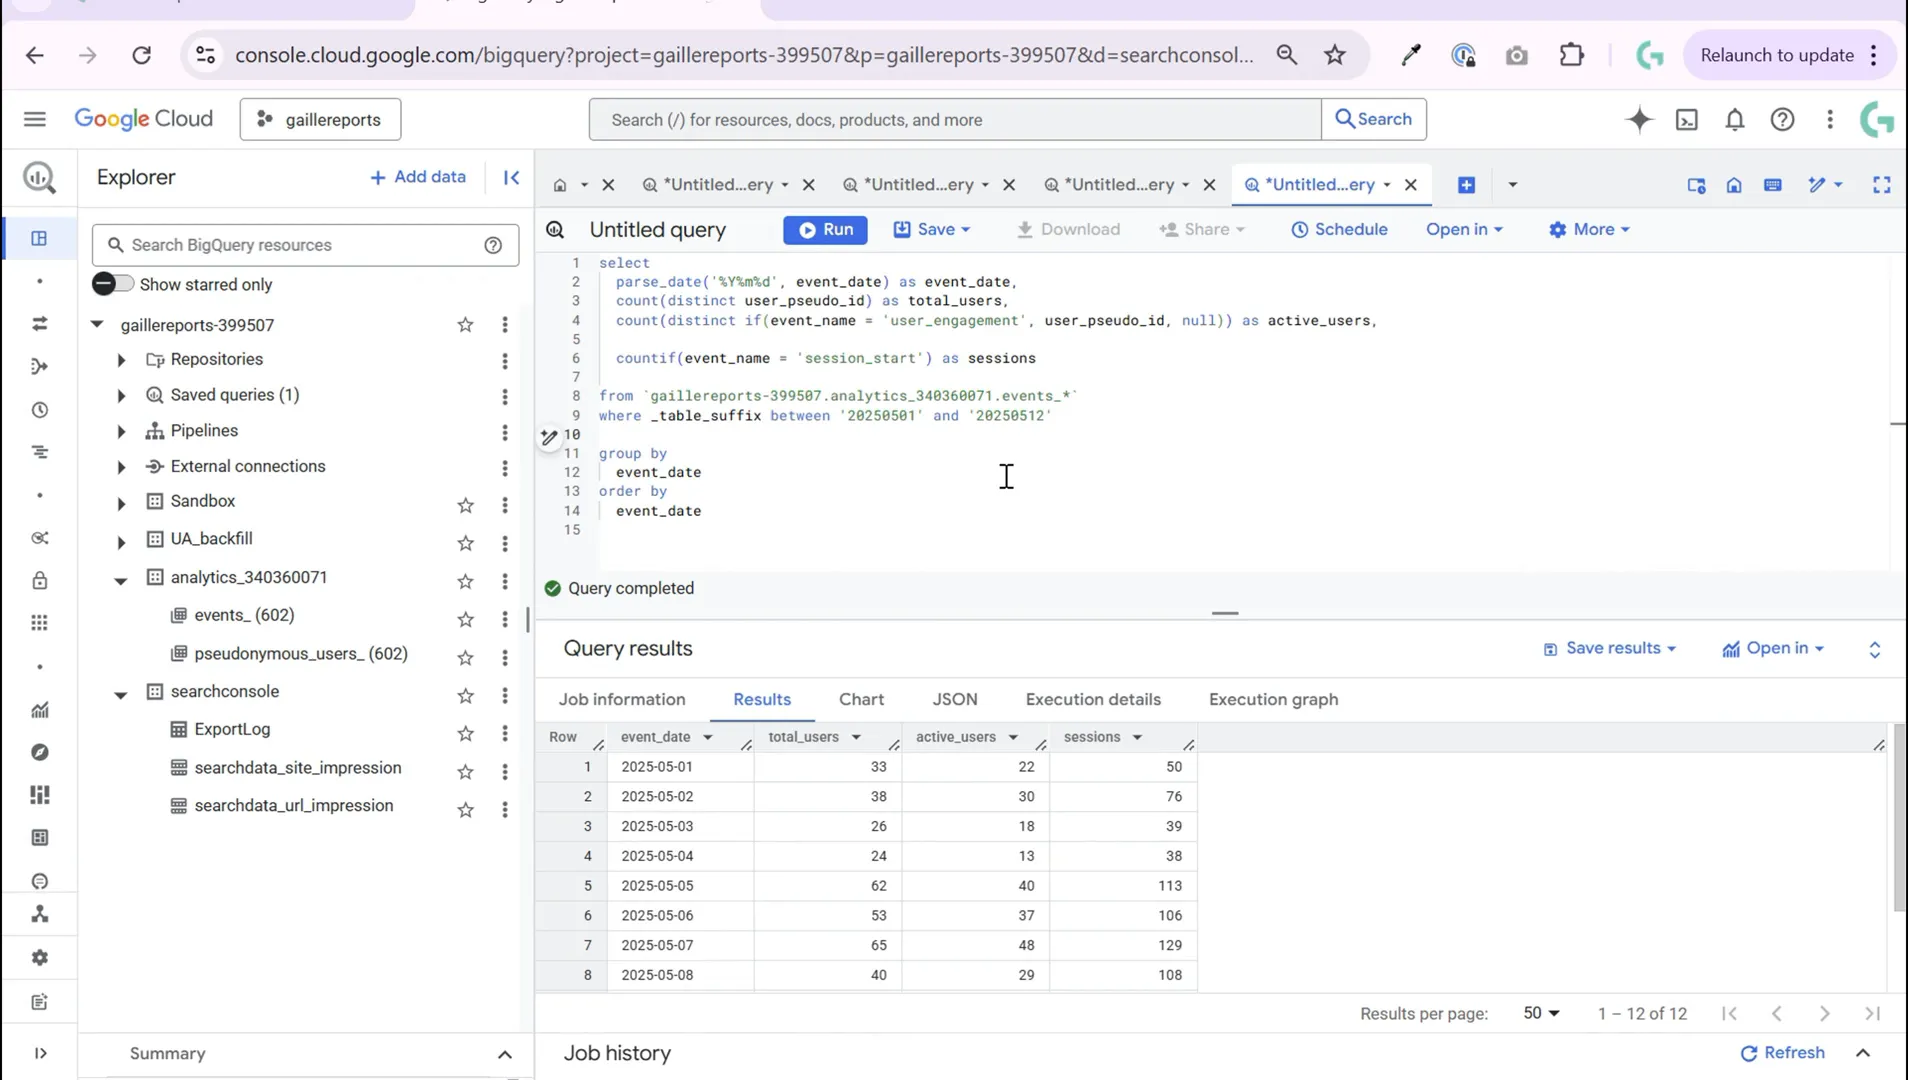
Here’s a query that combines total users, active users, and sessions by day:
SELECT
  PARSE_DATE('%Y%m%d', CAST(event_date AS STRING)) AS event_date,
  COUNT(DISTINCT user_pseudo_id) AS total_users,
  COUNT(DISTINCT IF(event_name = 'user_engagement', user_pseudo_id, NULL)) AS active_users,
  COUNT(IF(event_name = 'session_start', 1, NULL)) AS sessions
FROM
  `your_project.your_dataset.events_*`
WHERE
  _TABLE_SUFFIX BETWEEN '20230501' AND '20230512'
GROUP BY
  event_date
ORDER BY
  event_date
This query gives you a comprehensive daily overview:
- total_users: all unique users.
- active_users: users who engaged with your site.
- sessions: number of sessions started.
Sessions generally outnumber users since one user can have multiple sessions in a day, which is normal behavior.
Step 5: Connecting Your BigQuery Data to Looker Studio
Once you have crafted your queries in BigQuery, the next step is to visualize these metrics in Looker Studio (formerly Google Data Studio). The recommended workflow is:
- Connect your GA4 data export to BigQuery.
- Create and save your SQL query as a view or scheduled query in BigQuery.
- Connect Looker Studio directly to the saved view or query results in BigQuery.
This setup ensures that your Looker Studio dashboard always reflects the latest data, with minimal manual updates. Visualizing daily active users, total users, and sessions helps marketers and analysts track website or app performance over time.
Summary and Next Steps
In this tutorial, you learned how to:
- Query GA4 data in BigQuery across multiple days using wildcard tables.
- Count daily active users by filtering for the
user_engagementevent. - Calculate total daily users without event filtering.
- Use conditional counting with
IFto compare active users and total users side-by-side. - Convert integer event dates into proper date formats using
PARSE_DATE. - Count daily sessions by tallying
session_startevents. - Connect your BigQuery results to Looker Studio for dynamic reporting.
With these skills, you can confidently analyze your GA4 data in BigQuery and build insightful dashboards that tell the story of your users’ engagement and behavior.
If you’re interested in diving deeper into date functions or interactive reporting in Looker Studio, here are some helpful articles to continue your learning journey:
- BigQuery Date Function: Find the First and the Last Day of Month
- Interactive Date Aggregation in Looker Studio: Easy Date Switch
- Find the First Day of the Week in Looker Studio
Feel free to explore these resources to sharpen your BigQuery and Looker Studio skills further!

Leave a Reply