
How to Create Interactive Date Aggregation in Looker Studio
How can we make daily and monthly reports in the easiest and fastest way possible? Date Aggregation in Looker Studio will help us out with that!
Don’t forget to check out the video tutorial for your better understanding!
How to change date aggregation in Looker Studio?
Method 1

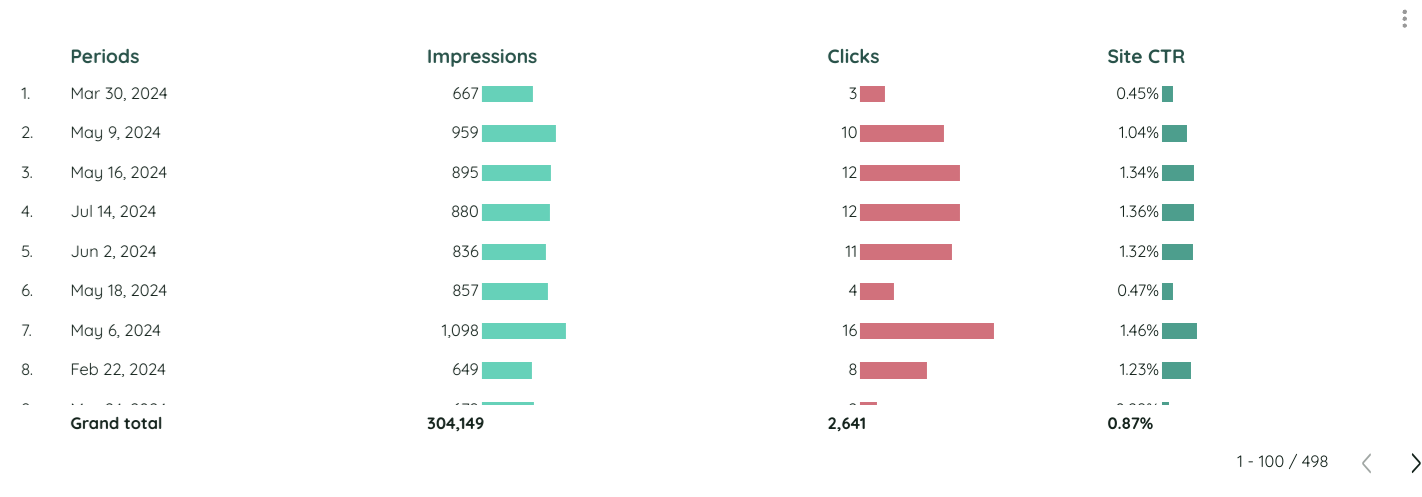
We have a chart and a table with data day by day. But what if I need to make it week by week or month by month? No, I won’t create a new chart each time.
Using drill down dimensions is also possible – we will have an automatically made drill down to days, months and years. In a view mode the users will only see the arrows to change the aggregation. One more disadvantage of this method is that you have to set up the drill-down for each chart on the page and while viewing it one chart may show daily data, another one weekly etc.
So what do we do to change date aggregations in one time in the whole dashboard?
Method 2
Basically, we need to create an additional parameter. To do this we have to go this way:
- Find your data source in the right panel and click “Edit”
- Click “Add parameter”
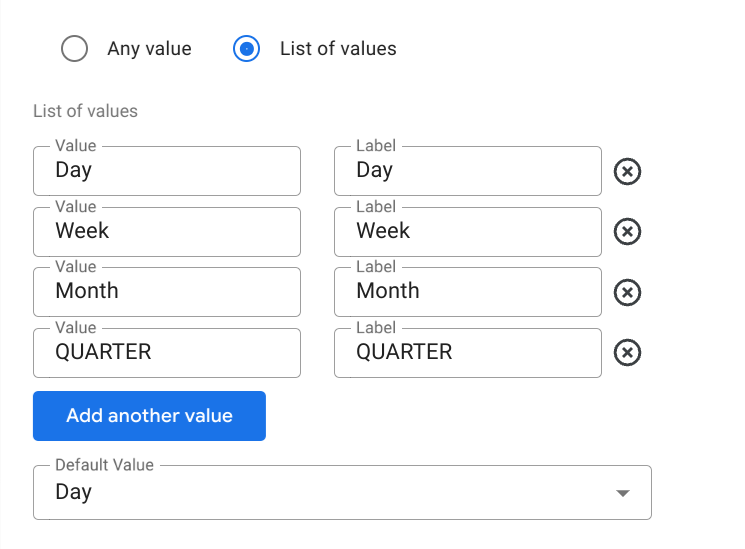
- Create a parameter named “Period”.
- Select text as a data type.
- Select the list of values
Then, we have to create a calculated field in the same data source settings. Just click the button “Add a field”, name it “Periods” and then write a following condition:
CASE
WHEN Period = “Day” then Date
WHEN Period = “Week” then date(DATETIME_TRUNC(Date, WEEK))
WHEN Period = “Month” then DATE(DATETIME_TRUNC(Date, MONTH))
WHEN Period = “QUARTER” then DATE(DATETIME_TRUNC(Date, QUARTER))
END
Our next step is to change the Date dimension in the chart and table to Periods.
Followingly, we have to add a fixed-type list type of control to our dashboard. As a control field we need to use our Period parameter.
Why is date aggregation important?
When dealing with time-based data, date aggregation is a vital element not to miss, and here is why:
1. Data Summarization
Aggregating data by date helps you group and summarize large amounts of data, making it easier to identify trends. Instead of looking at raw data on a daily basis, you can aggregate by week, month, or quarter to gain insights into overall performance over time.
2. Trend Analysis
Date aggregation enables you to spot trends and patterns. For example, aggregating sales data by month or quarter can help you see seasonal trends or yearly growth rates. Without aggregation, the data might be too granular and difficult to interpret.
3. Improved Performance
Aggregating data by date reduces the number of data points that need to be processed and displayed. This can improve the performance of your reports, especially when working with large datasets, leading to faster load times and better user experience.
4. Comparative Analysis
By aggregating data by date, you can easily compare performance across time periods, such as comparing this month’s performance to the previous month or this year’s performance to the previous year. This helps in understanding business growth and forecasting.
5. Customizable Reporting
Date aggregation allows you to tailor reports to specific time intervals that are meaningful to your audience, such as daily for operational reports, weekly for tactical reviews, or quarterly for strategic planning. It offers flexibility in how data is presented.
6. Simplified Visualizations
Aggregating by date allows for easier-to-read visualizations, like line charts, bar charts, and area charts, where aggregated time-based data reveals patterns more clearly. This makes dashboards more accessible and actionable for decision-makers.
Conclusion
Summing up, the advantage of this method is that it will change the date aggregation of all the charts in the dashboard in a single time. In Looker Studio, controlling date aggregation helps ensure that your visualizations are not only accurate but also optimized for analysis, providing deeper insights in a more digestible format
Hope this article was interesting and useful for you! In addition I would really like to recommend you to check out our New and Return Customers Growth report template – you can try to use the trick from the article in it!
Share your impressions about the article in the comments section!