
Looker Studio template overview: Google Analytics 4 SEO and Paid traffic report for online store
One of the most popular dashboards you can find in my template store is Google Analytics 4 Paid traffic and SEO report for an online store. There you can read a description of the report template and see what it looks like. In this article I would like to make a detailed overview of the report. Keep following!
If you prefer video format – check out this video:
Data sources and pre-setup of Paid traffic and SEO template
This dashboard is based on 4 data sources – Google Analytics, Google Ads, and two Google Search Console data sources. Hence, this report template will give you an extended view on paid and organic traffic. I used Google Analytics 4 demo account and samples of Google Search Console and Google Ads. To work with this report, connect your data sources instead of mine – it is that easy!
In this GA4 Paid traffic and SEO report I’ve created and applied some filters: GA4 Organic + Paid Traffic, GA4 Organic Only, GA4 Paid Only. To be more precise, I selected First user default channel grouping that includes both “Organic” and “Paid”, or only “Organic”, or only “Paid”.
For the first page I’ve applied the “Organic + Paid” filter, so let’s move on and see what we have here!
Google Analytics Organic + Paid page
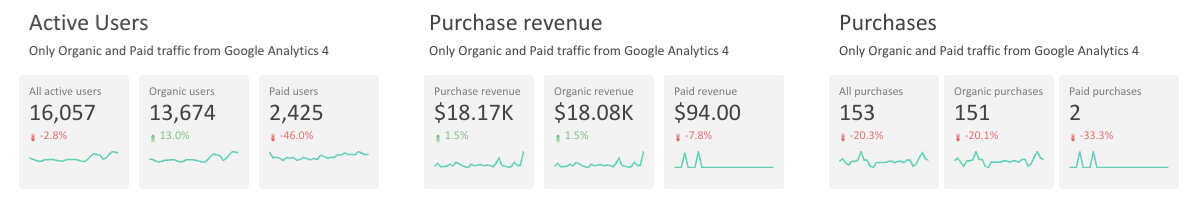
By default, the data range of this report is “last 30 days” until yesterday so that we could have full info. The first page starts with the KPIs. Here we can see detailed information about active users (total, organic and paid), purchase revenue and purchases.
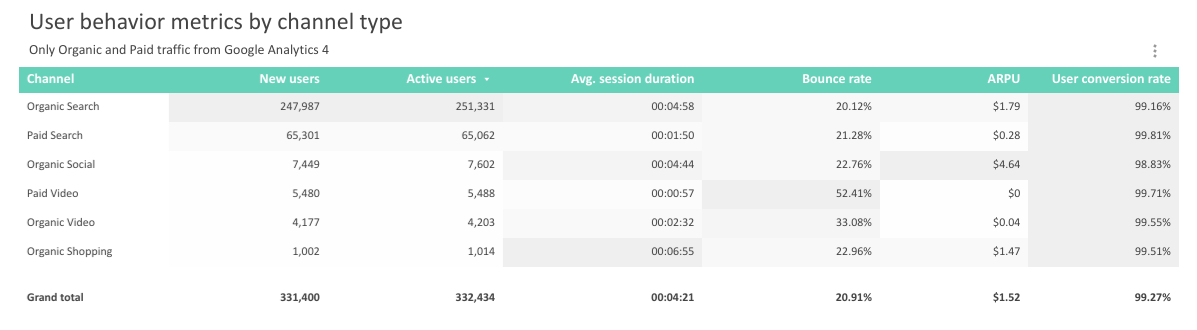
Followingly, there is a pivot table that gives us an understanding of performance in terms of new users, active users, average session duration, bounce rate, ARPU and user conversion rate with a traffic breakdown by channels. If you want to change it, you can do it.

Then, we can find general information about active users – about the devices they use, genders, age and countries. The demo account has a disadvantage, as you can see, the biggest part of genders and ages is unknown.
Ecommerce Organic + Paid traffic
On the second page we can already see the filters – Channel Group and Item Category, so that we can split data by traffic channels and item categories.

This is how this page looks like. Besides main KPI score boxes we have a pivot table that shows us the number of purchases split by months and channels. There is an optional metric that allows you to present ecommerce revenue as well. It allows you to see how the number of purchases has changed month by month.
Then we have product performance. Here we can see Item brands, Item categories, Item IDs, Item names and some metrics for each item, so we could see the number of items viewed, items viewed in promotion etc.
Only organic data
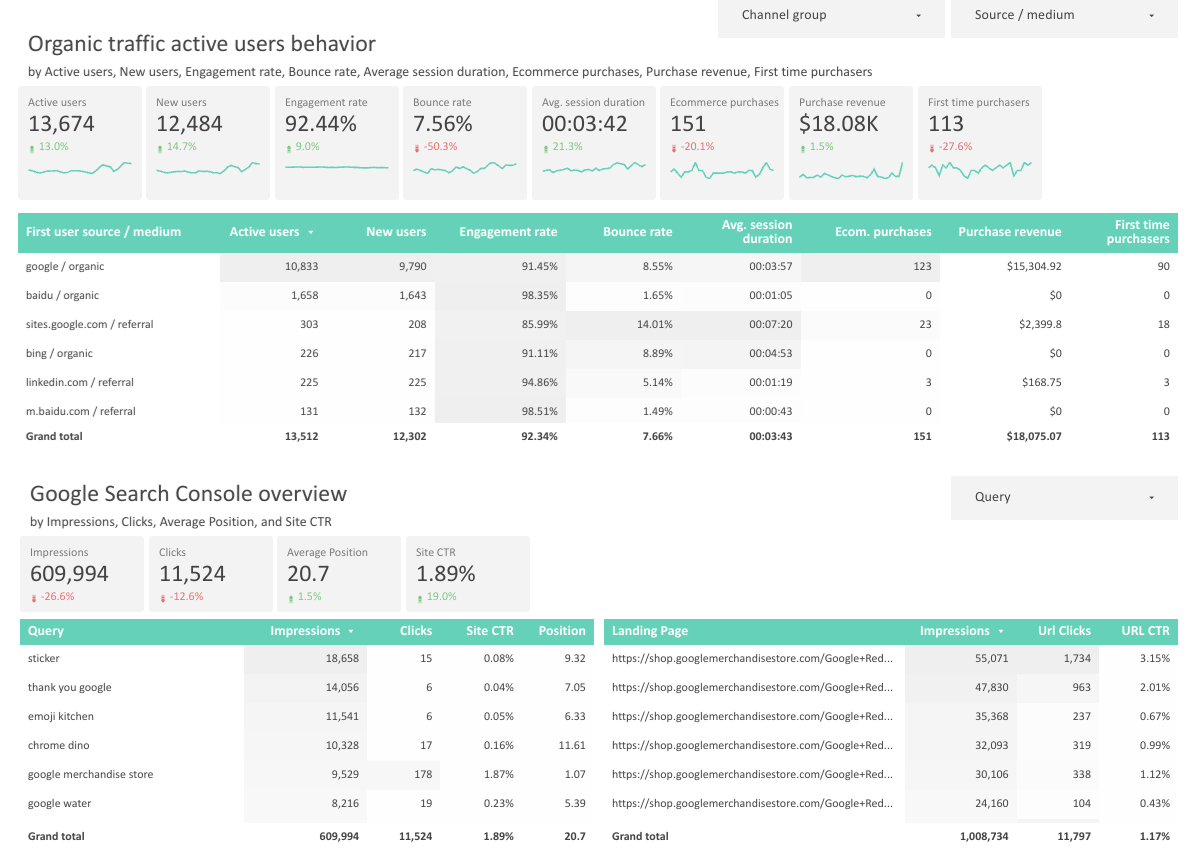
Our organic traffic page starts with filters like channel group and source/medium as well as the details of active users behavior. Organic Search contains data from Google while Organic Social – from Facebook. The KPIs we can see are the following: active users, new users, engagement rate, bounce rate, average session duration, ecommerce purchases, purchase revenue, first time purchasers.
In the table of this section we have a breakdown of above-mentioned metrics by first user source / medium. This was data from Google Analytics. Then we have a Google Search Console overview.
There are score boxes with basic metrics – impressions, clicks, average position and site CTR. Besides that, we have a filter with queries. Below we have tables with queries and statistics for landing pages.
Paid traffic only
This page is similar to the previous one but here we talk only about paid traffic, especially about Google Ads.
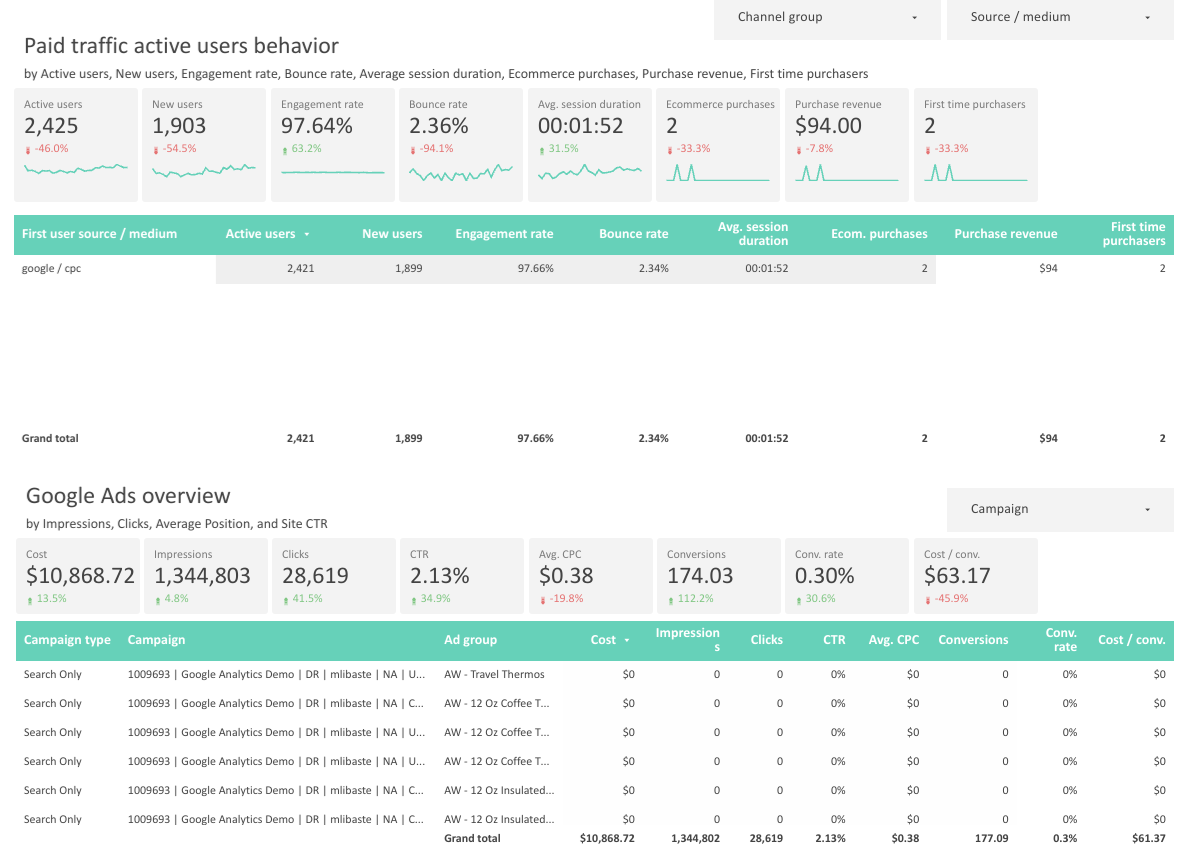
The key metrics and the table in the user behavior section are the same. But then we have a Google Ads overview that is quite different. There is a campaign filter to split your data. We have such metrics as cost, impressions, clicks, CTR, average CPC, conversions, conversion rate, and cost/conversion. The pivot table contains metrics data split by campaign type, campaign and ad group.
If you want to know more about Looker Studio and start your life changing freelancing data visualization career, you are more than welcome to my Gaille Reports course. Read more about it here.
Hope you liked this report and the article-overview of Paid traffic and SEO template. Share your impressions in the comments section and don’t forget to follow the newsletter!
Check out more articles of mine in Medium.