
Looker Studio, formerly Google Data Studio, practical guide
Google Looker Studio online course
→ Learn how to prepare, analyze, and visualize data using Google Looker Studio.
→ Master the creation of comprehensive dashboards based on key metrics and without programming.
→ Consolidate your knowledge through hands-on practice: complete 10 assignments and a final project.
Join the waiting listView programStart anytime
6,5 hours of video
75 video lectures, 10 practice, 10 quizzes
Final project
Why it is important to learn Looker Studio?
Looker Studio allows for the collection, analysis, and visualize data.
Businesses make decisions based on complex dashboards, rather than intuition, which is why professionals proficient in Looker Studio are in high demand in the market.

Who is the Looker Studio online course for?
Beginners
Learn an in-demand tool and advance to a new career level, which is essential for most of the large companies.
BI analysts
You will be able to collect and process data faster, allowing you to spend more time uncovering insights and presenting them in clear, visually appealing reports for your colleagues.
Marketers
Know how to independently set up necessary dashboards and track the effectiveness of marketing tools in real-time.
Web analysts
Apply a new tool for working with data from various sources and build a comprehensive analytics of marketing activity.
During the Looker Studio online course, you will learn...
Design impressive, self-updating, interactive dashboards and reports that effectively communicate your data insights.
Become proficient in using all chart, graph and table types offered by Google.
Gain a deep understanding of data visualization theory and learn how to structure the process of creating effective dashboards.
Gain expertise in advanced Looker Studio functionalities, such as comparison calculations, filters, calculated fields, data blending.
Choose metrics and dimensions for your charts based on key performance indicators (KPIs) relevant to your business.
Learn about the Looker Studio Partner connector services and their capabilities.
You will have tasks that can be added to your portfolio.
During the Google Looker Studio, formerly Google Data Studio, online course, you will complete 10 homework assignments and a final project where you will integrate your acquired knowledge.
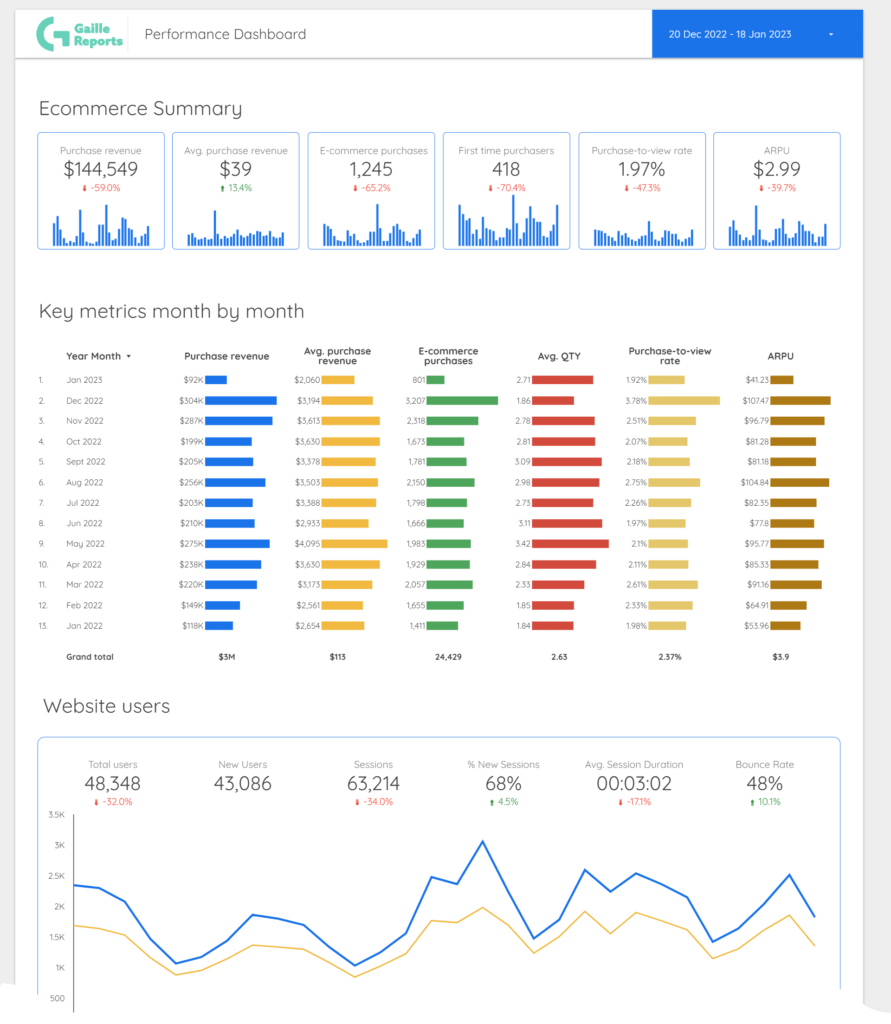
In this hands-on Looker Studio online course, you will learn to create a digital marketing dashboard from scratch.
The training will use a business case scenario where you, as a digital marketing manager for an online store, will prepare a report for your monthly meeting with top management.
The dashboard will be based on either Google Analytics 4 or Universal Analytics data sources, providing tips for both versions so you can choose the one that best suits your needs.
By using real data for the course report, you will be able to apply the skills learned to your own work and gain valuable insights for your business.
Ready to learn?
Looker Studio online course program
The course is divided into 12 sections, each focusing on a specific theme. You will have 6.5 hours of video lectures, 10 homework assignments, and 10 quizzes to assess your understanding. To ensure a comfortable learning experience, it is recommended to allocate approximately 5 hours per week for lectures and homework over the course of one month.
In this module, we will delve into the capabilities of the tool Google Looker Studio and explore its practical applications. If you do not already have a Looker Studio account, we will assist you in setting one up. Additionally, we will establish a specific business case for demonstration purposes.
- 4 lecture
- 8 min
During this section, we will cover the key components of a dashboard. We will discuss how to identify and define report specifications, and delve into the concepts of layout and grids. Essentially, this section will provide the theoretical foundation for the hands-on practice that will follow.
- 4 lectures
- 12 minutes
Section 3 will delve into the two types of data sources available in Looker Studio. We will guide you through the process of creating a blank report and connecting it to your first Google Analytics (4 or Universal) data source. Furthermore, we will demonstrate how to customize the appearance of the dashboard by setting up its theme.
- 7 lectures
- 46 minutes
- Homework
- Knowledge Check
In this section, we will cover the following topics:
- Setting up a date range
- Working with shapes and lines, images, and text elements
- Positioning elements and aligning them
- Adding page or report-level elements
By the end of this section, you will have a good understanding of how to use these features in Looker Studio.
- 5 lectures
- 35 minutes
- Homework
- Knowledge Check
Following section is focused on presenting key performance indicators (KPIs). We will begin by identifying which metrics are relevant as KPIs for our use case. We will then proceed to create scorecards and bar charts to display them. Additionally, we will cover the importance of setting a report date range and how to effectively utilize the align and distribute features in Looker Studio. By the end of this section, you will have a solid understanding of how to present your KPIs in an effective and visually appealing manner.
- 5 lectures
- 34 minutes
- Homework
- Knowledge Check
In this section, we will delve into the creation of tables in Looker Studio. We will cover the following topics:
- Creating a simple table and reviewing all the available settings and style options.
- Utilizing custom date range and drilling down into the details.
- Resizing columns and using row numbers to show data in a specific order.
- Exploring simple and advanced table sorting options.
- Applying different rules to style the table, such as using heatmaps and bar charts for better visualization.
- Creating a new section in your report and adding and stylizing a table with your key performance indicators (KPIs) by month. By the end of this section, you will have a solid understanding of how to create and customize tables in Looker Studio to effectively present your data in a clear and visually appealing way.
- 9 lectures
- 41 minutes
- Homework
- Knowledge Check
In this section, we will focus on working with user metrics. Specifically, we will:
- Set up a time series chart and customize its appearance.
- Explore the use cases for lines and bar charts and the benefits of a double y-axis.
- Provide design advice for creating effective visualizations.
- Create a section title and select appropriate metrics to describe our users.
- Create a time series chart and review the available settings.
By the end of this section, you will have a good understanding of how to effectively visualize user metrics using time series charts in Looker Studio.
- 5 lectures
- 28 minutes
- Homework
- Knowledge Check
In this section, we will focus on understanding and utilizing individual page settings in Looker Studio to effectively present data from a tech website. We will cover the following topics:
- Using pie charts, stacked bar charts, and pivot tables to present data.
- Reviewing metrics and dimensions available in both Google Analytics 4 (GA4) and Universal Analytics, and determining which are the best fit for our goals.
- Emphasizing the importance of understanding the data you work with and how to choose the appropriate metrics and dimensions, as well as the correct chart type to effectively present the data.
By the end of this section, you will have a solid understanding of how to effectively present data from a tech website using various chart types and metrics in Looker Studio.
- 9 lectures
- 45 minutes
- Homework
- Knowledge Check
In this section, we will delve into creating and customizing a geo chart in Looker Studio. We will cover the following topics:
- Creating a new geo chart and discussing its settings and logic.
- Configuring metrics and dimensions for the chart.
- Updating the styles of the chart, including different color scales and legends.
- Creating a supporting table for the geo chart to better understand the data.
- Exploring options for designing Google maps and comparing them to geo charts.
- Examining different styles of bubble maps and selecting the best option for our report.
By the end of this section, you will have a good understanding of how to create and customize geo charts in Looker Studio and how to make use of Google maps to enhance your data visualization.
- 6 lectures
- 26 minutes
- Homework
- Knowledge Check
In this section, we will use a bubble chart to provide an overview of channels data. We will cover the following topics:
- Reviewing the settings available for bubble charts.
- Explaining how to interpret and read bubble charts.
- Customizing the legend and color of bubbles.
- Creating a simple table to review the data and make decisions about the most appropriate chart type to present the data.
By the end of this section, you will have a good understanding of how to use bubble charts in Looker Studio to present channels data and how to customize the chart to improve its visual appeal.
- 4 lectures
- 23 minutes
- Homework
- Knowledge Check
In this section, we will focus on creating a product breakdown using a TreeMap graph. We will cover the following topics:
- Creating a table with product data and adding relevant metrics for this section.
- Creating a TreeMap chart and reviewing its settings and styles.
- Exploring the different types of control elements available in Looker Studio.
- Demonstrating how control elements can be used to apply filters to specific charts and tables.
- Adding a footer to the dashboard and providing a quick overview of the entire dashboard.
By the end of this section, you will have a good understanding of how to create a product breakdown using a TreeMap graph in Looker Studio and how to utilize control elements to filter and manage data.
- 6 lectures
- 37 minutes
- Homework
- Knowledge Check
In this section, we will explore advanced functionality and data management techniques in Looker Studio. We will cover the following topics:
- Creating a new page for experimentation and experimenting with different comparison calculation options.
- Reviewing filters based on the “medium” traffic source filter, with the condition of ‘cpc’ or ‘cpm’.
- Adding custom metric and dimension fields, using the CASE function as an example.
- Creating calculated fields on the report level and comparing it with the chart level.
- Introducing the concept of blended data sources and reviewing different types of joins.
- Testing blends on a simple example by creating a new blended data source based on Universal Analytics and Paid traffic filter, and creating a table and chart based on the new blend.
- Overview of partner connector services and providing recommendations for their use.
- Copying the dashboard and changing the data source. By the end of this section, you will have a good understanding of how to use advanced calculations and data management techniques in Looker Studio, and how to effectively blend data sources to create powerful and informative visualizations.
- 9 lectures
- 61 minutes
- Homework
- Knowledge Check
Google Looker Studio online course Instructor
“Looker Studio is a user-friendly and powerful tool for managing data, and is part of the widely used Google Suite. It allows for easy data analysis and visualization, enabling data-driven decisions to improve business operations.
Understanding how to present data in a clear and understandable manner is a valuable skill for career advancement and growth.
This course serves as an excellent starting point for a career in data analytics, providing a comprehensive foundation in the field and the tools used to analyze and visualize data. It can also lead to further studies in areas such as data engineering or data science.“
Gala Ivannikova
The author and instructor of the course. Gala has a decade of experience in marketing and 4 years in marketing analytics. She’s the founder of a boutique digital marketing agency and currently works in Business Intelligence and data analytics for global companies. Founder of Gaille Reports.
Want to start learning?

Show examples of dashboards used in analytics.
Data dashboard examples that cut clutter and surface key KPIs...
Read More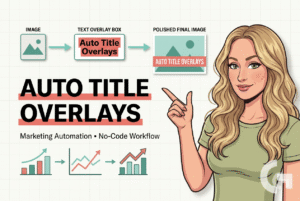
Add Text Overlay Images: 5 Smart No-Code Steps
Learn how to add text overlay images with Make and...
Read More
Explain how pivot tables help summarize large datasets.
Google Sheets pivot tables tutorial for marketers: turn raw data...
Read More