
Looker Studio template for Advertising Agencies: Plan & Fact spending trajectory for paid ads

One of the basic and most useful reports for advertising agencies is Plan & Fact spending trajectory for paid ads like Google Ads, Facebook Ads, Microsoft Ads and so on. You can find this report template in my template store.
This report will come in handy for the ones running ads on several ads platforms at the same time.
You can check out also the video overview:
Looker Studio
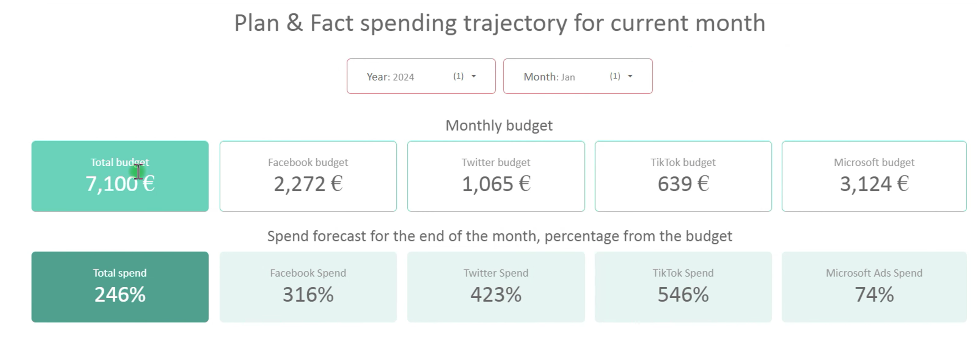
This is a one-page dashboard and it starts with Monthly budget and Spend forecast for the end of the month.
As you can see, there are four ads platforms and all the data in the report will be based on it. In the monthly budget we can see what our budget is, and below we can see how many percent of the budget we will spend if we keep spending as we do now.

Then we have charts that show the percentage of spend for today.

The next section is Total spending trajectory. In this chart we can see Total Spend, Planning total spend and Trajectory total. There is also a line that shows us a Period limit – the maximum we could spend, but as we can see here, we’ve overcome that line “successfully”.
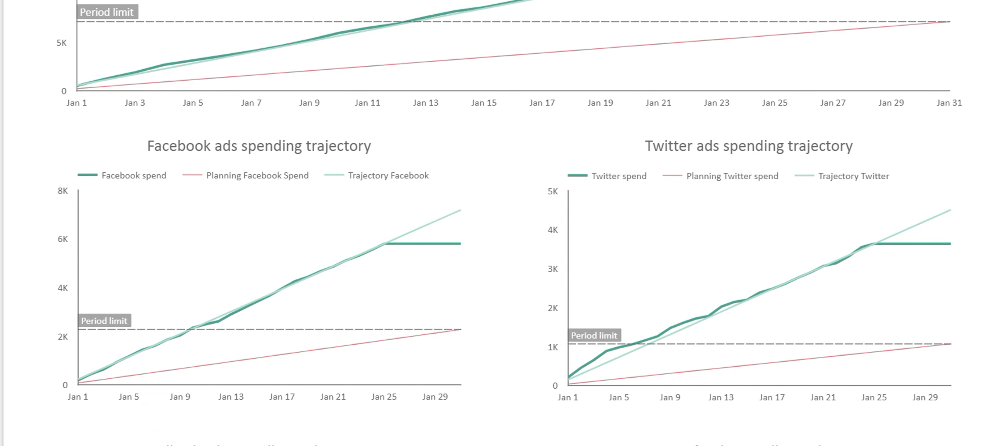
Followingly, we have charts like the previous one for every Ad platform separately.

The next section we have is Paid traffic channels ROAS overview.
I’ve added filters and drill-downs so it would be much easier to use.
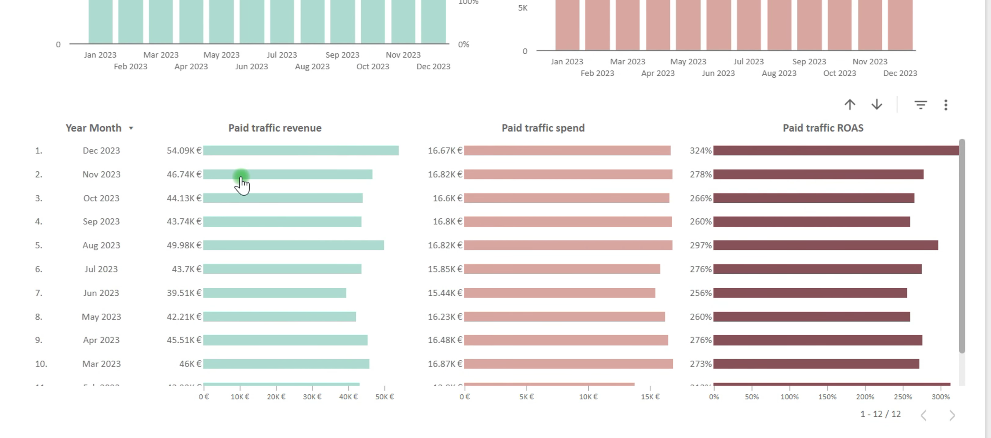
Below, we have breakdown of Paid traffic revenue, Paid traffic spend and Paid traffic ROAS month by month.

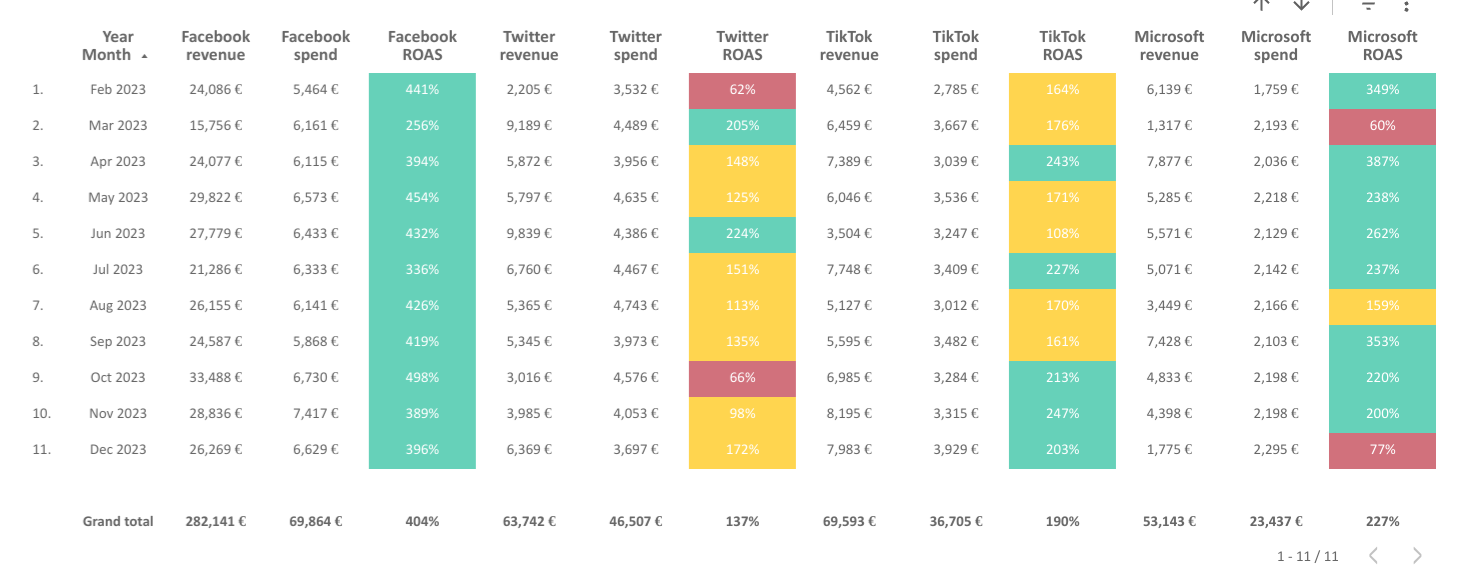
Then we have traffic channel comparison. Current line chart on the image shows ROAS for each ad platform separately month by month. By default we have ROAS here, but I enabled optional metrics, so you can choose what metric to present in the chart.
Back-end in Google Sheets
There is only one data source of this report. It is a Google Sheet table you will get to set up your dashboard.
It starts with a Help tab. Here is where you get all the necessary information you need to know to start working with the current Google Sheets and Looker Studio dashboard.
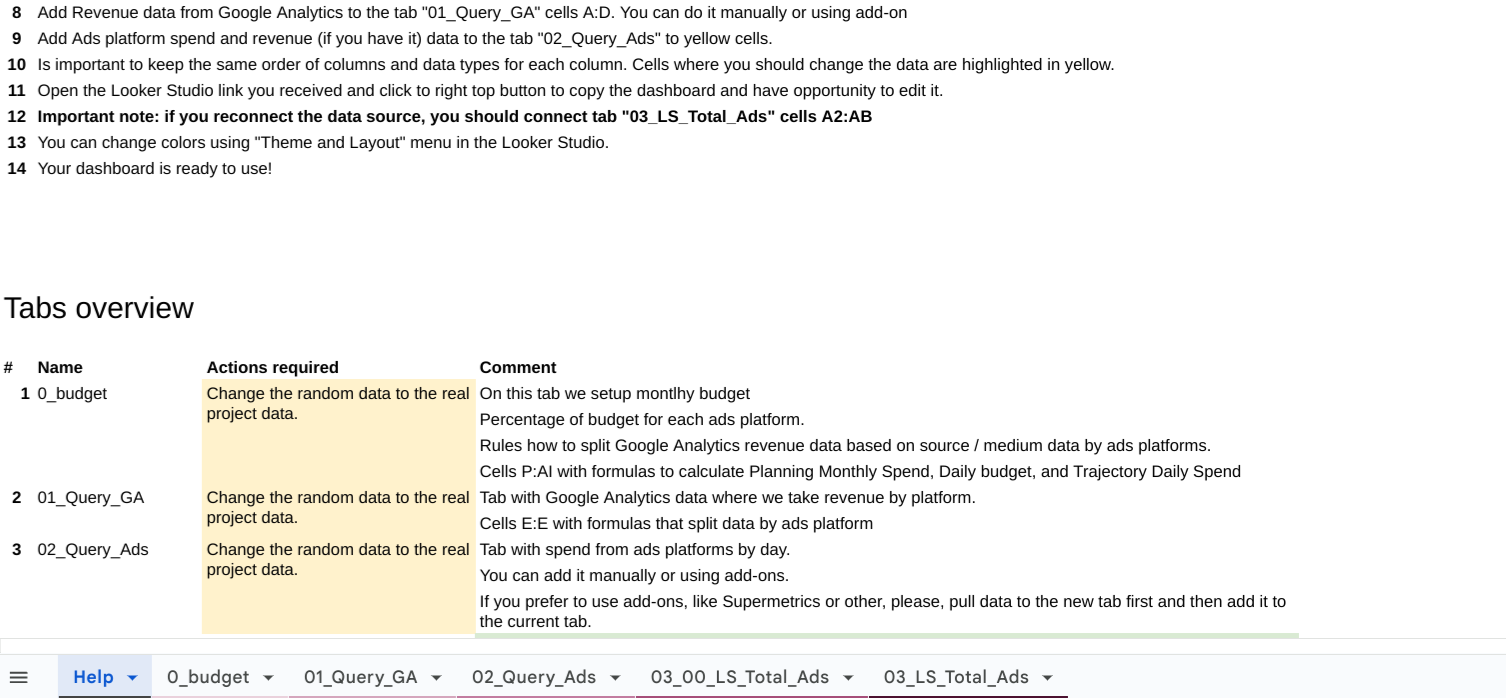
Basically what you need to do is to fill all the yellow cells with the data.
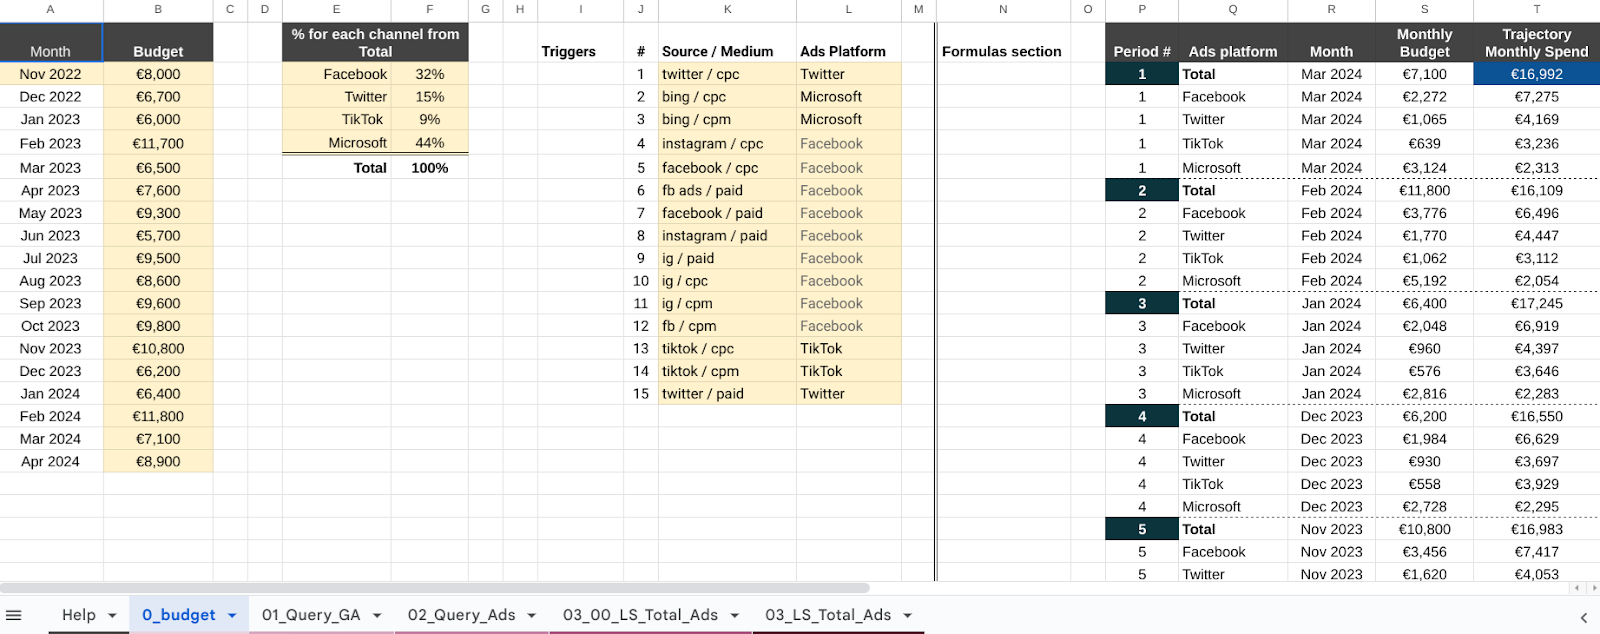
We have a budget tab – here you need to input your real budget, % for each channel from total. Besides that, there is basic data required from Google Analytics, like Source/Medium and corresponding Ads Platforms (like Twitter, Facebook Ads, Google Ads etc.) to set up the rules for the next tab.

On the page “Query” we need to export data from Google Analytics. As you see, using the rule on the previous tab, based on Source / Medium, we automatically get an ads platform.
Please, pay attention to the note beside the table.

In this tab you will need to insert the data for each of the ads platforms. If you need this report just once, you can do it manually, but if you need it to be updated, I really recommend to use some add-ons like Supermetrics, Windsor.ai and Power My Analytics. They will save you a lot of time.
In the next two tabs you don’t need to change anything – there are just formulas.
This report is pretty easy to use but it is quite challenging to create it, that is why I offer it as a template so it could make life of many marketers easier. You can purchase the Plan & Fact spending trajectory template in my store.
Hope you liked this article!
Tool I use for Looker Studio connectors
If you’re building dashboards in Looker Studio and need data from ad platforms, this is something I personally use quite often.
Windsor.ai connectors for Looker Studio let you pull marketing data directly into your reports so everything updates automatically.
If you decide to try it, they also offer a 10% discount with the promo code gaillereports.
Tool I use for marketing dashboards
A tool I’ve used many times for marketing dashboards is Supermetrics.
It helps pull data from different marketing platforms into tools like Google Sheets, BigQuery, or Looker Studio so your reports can update automatically.

