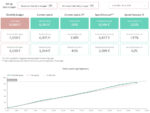
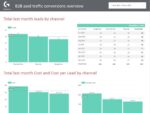
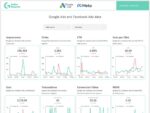
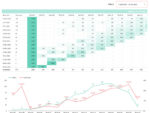
Our Plan vs Fact Spending Trajectory report is the perfect tool for monitoring and comparing your advertising costs. The report compares your planned budget with actual expenses and tracks key performance indicators (KPI). It also provides a cost forecast for advertising until the end of the month.
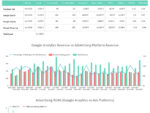
Data sources: manually set budget KPI, expenses data from the advertisement systems, Google Analytics revenue data to calculate ROAS.
Pre-sets: KPI task, uploading data from ads platforms. Required fields for the report: date, cost, planning budget.
Go to Looker Studio template page
The templates are delivered within 24 hours during the working days. The delivery requires manual processing but we try hard so in 90% of the cases we deliver it faster!
Watch the full video overview of the template
More details?
This report template is vital for digital marketing, advertising agencies, paid ads individual specialists and agencies.
Have you ever doubted on setting your budget? This report template will help you optimize resource allocation by identifying high-impact channels. Beside this, it allows you to set clear budgets aligned with your marketing and business goals.
Are you struggling with budget overruns? Our Plan vs Fact Spending Trajectory report will come in handy to analyze the spends and forecast to prevent overspending and stay within budget constraints. In addition, it prevents overallocation to underperforming channels and optimizes resource distribution for maximum impact.
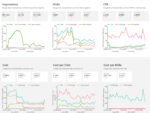
Do you still think that seasonality doesn’t matter? This report visualizes spending trends over time to identify patterns and seasonality and allows you to make informed adjustments based on changing consumer behavior or market dynamics.
There is no need to wait longer – purchase this Plan & Fact spending trajectory template and get your budget and spend in order again!