
How to Get GA4 Event Count in BigQuery: A Simple Step-by-Step Tutorial

If you’ve connected your Google Analytics 4 (GA4) property to BigQuery, you’ve already unlocked a powerful way to analyze your website’s event data. But what’s next? How do you start exploring your raw GA4 data in BigQuery to get meaningful insights? In this article, I’ll walk you through a simple, beginner-friendly tutorial on how to count how many times each event happens on your website using BigQuery SQL. This is the perfect first step to understand what events are tracked, identify any missing or misnamed events, and prepare your data for deeper analysis.
Before diving into the tutorial, I invite you to watch the full video tutorial here for a visual walkthrough: GA4 Event Count in BigQuery Video Tutorial. Now, let’s get started!
Step 1: Understand How GA4 Data Is Structured in BigQuery
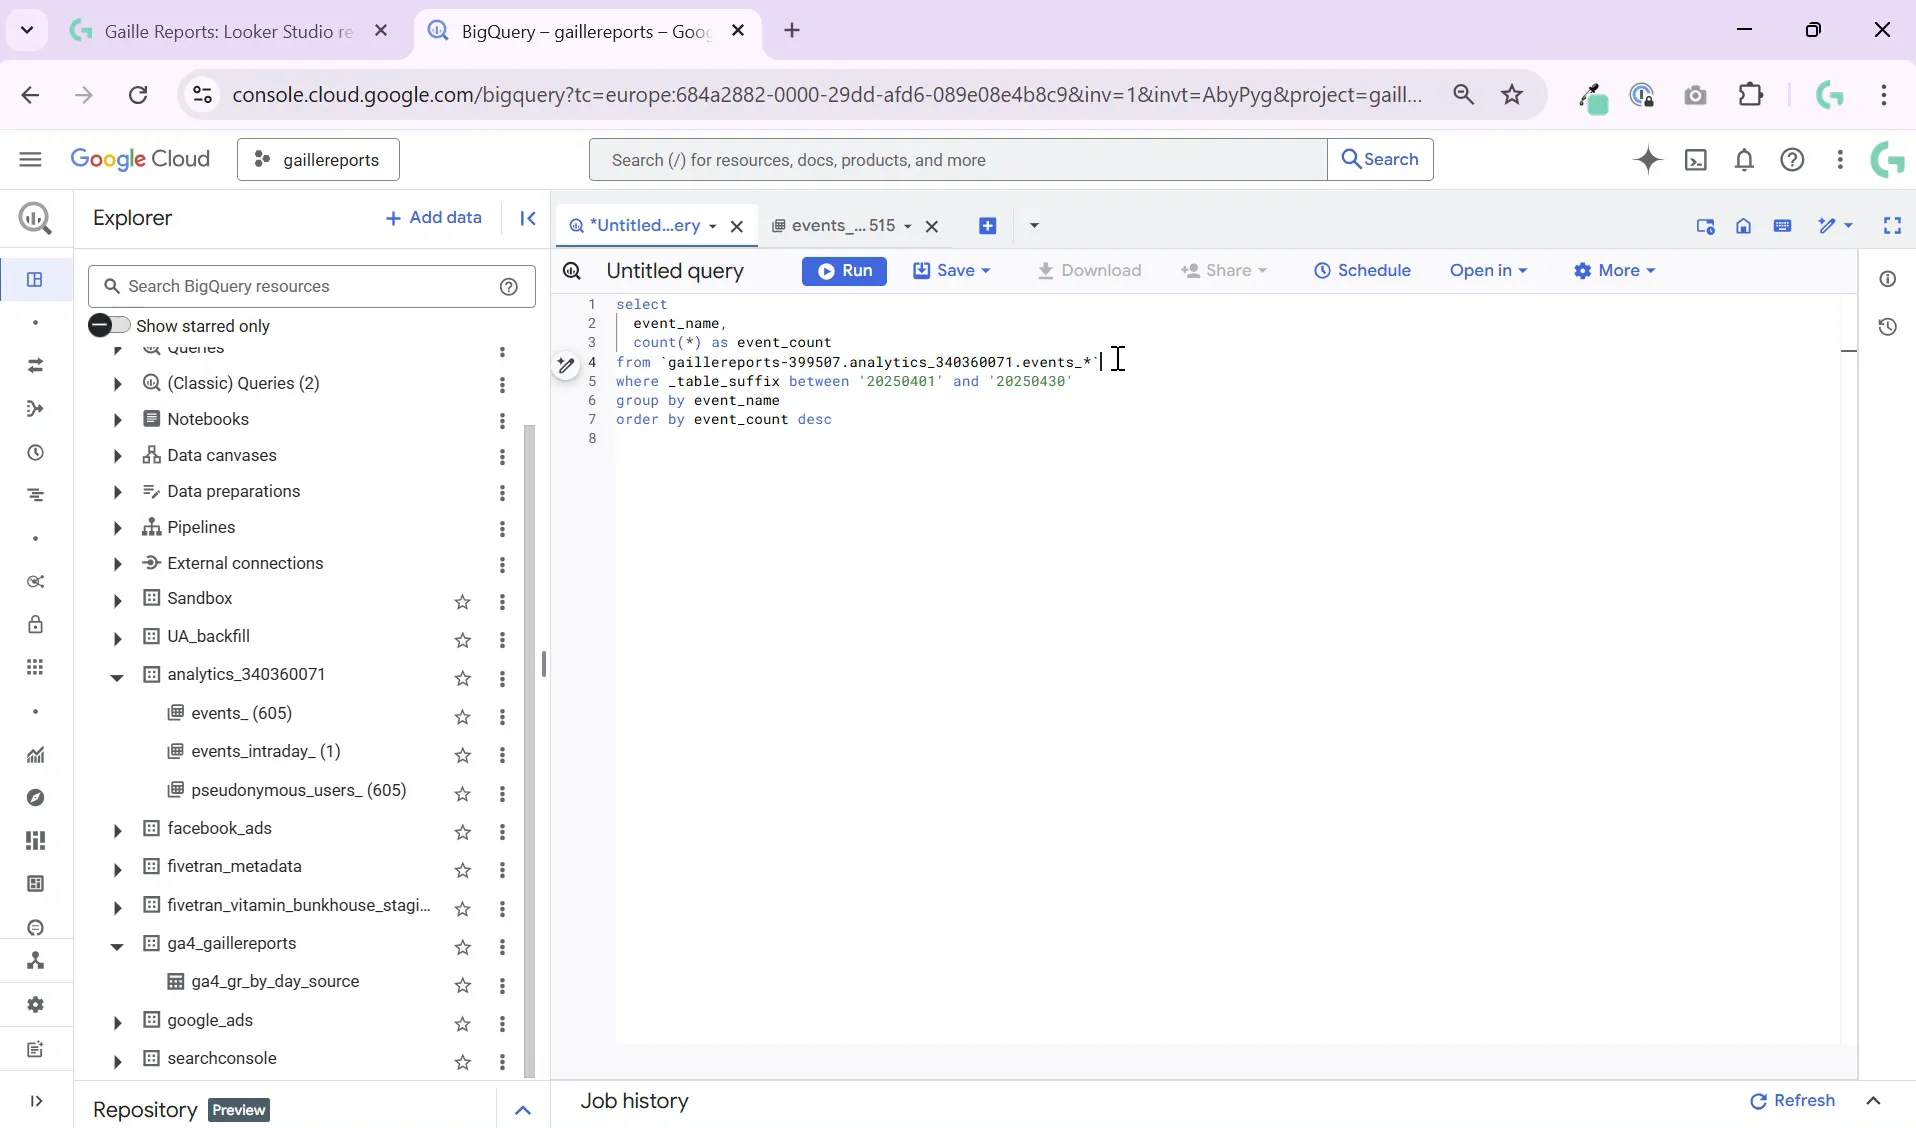
When GA4 exports data to BigQuery, each event is stored as a separate row in the events table. This means that the events table contains many rows, each representing an individual event that happened on your site or app. To explore this data, you first need to know which table to query.
Typically, the GA4 events data is stored in a table named events_* within your dataset. The asterisk represents a wildcard for date-sharded tables, meaning you have one table per day. To query across multiple days, you often use the table suffix wildcard.
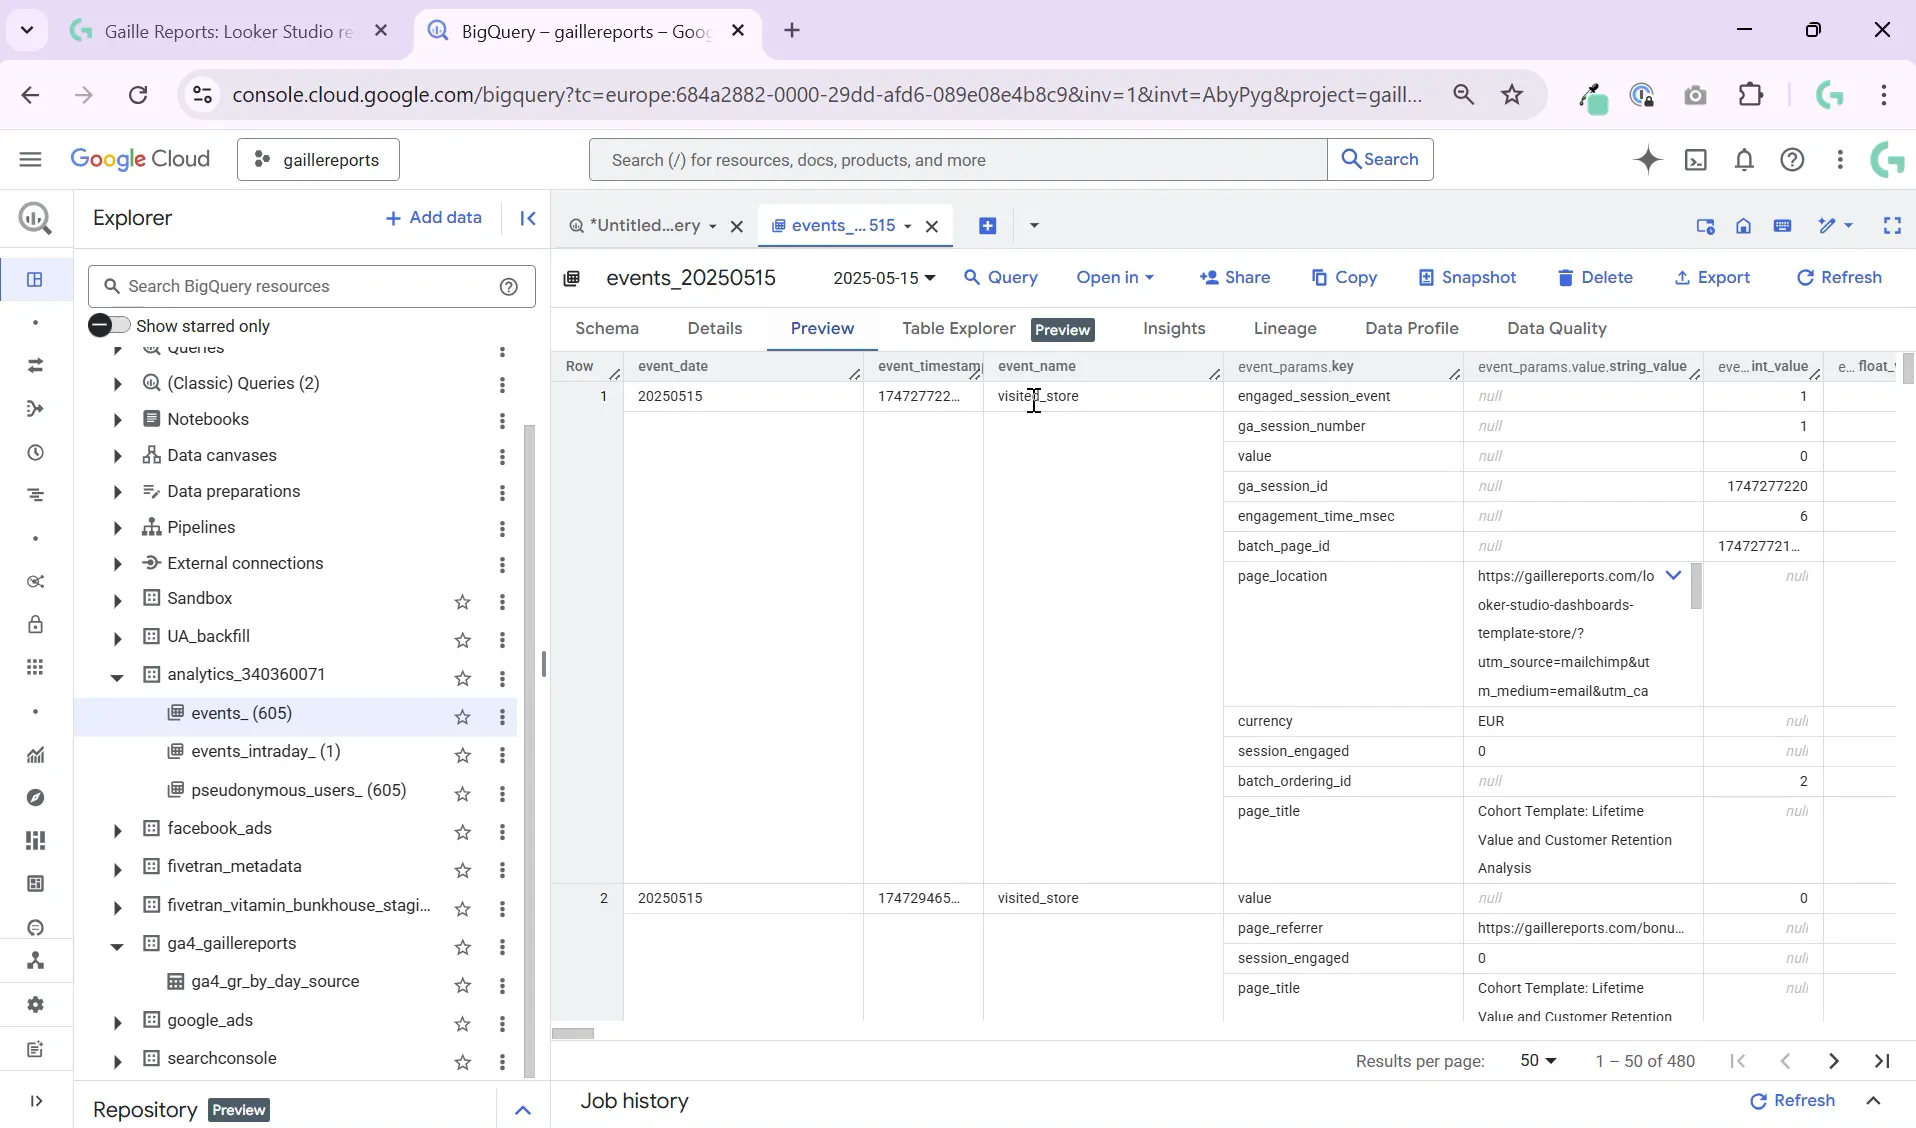
Here’s what a few rows of the events table look like when previewed in BigQuery:
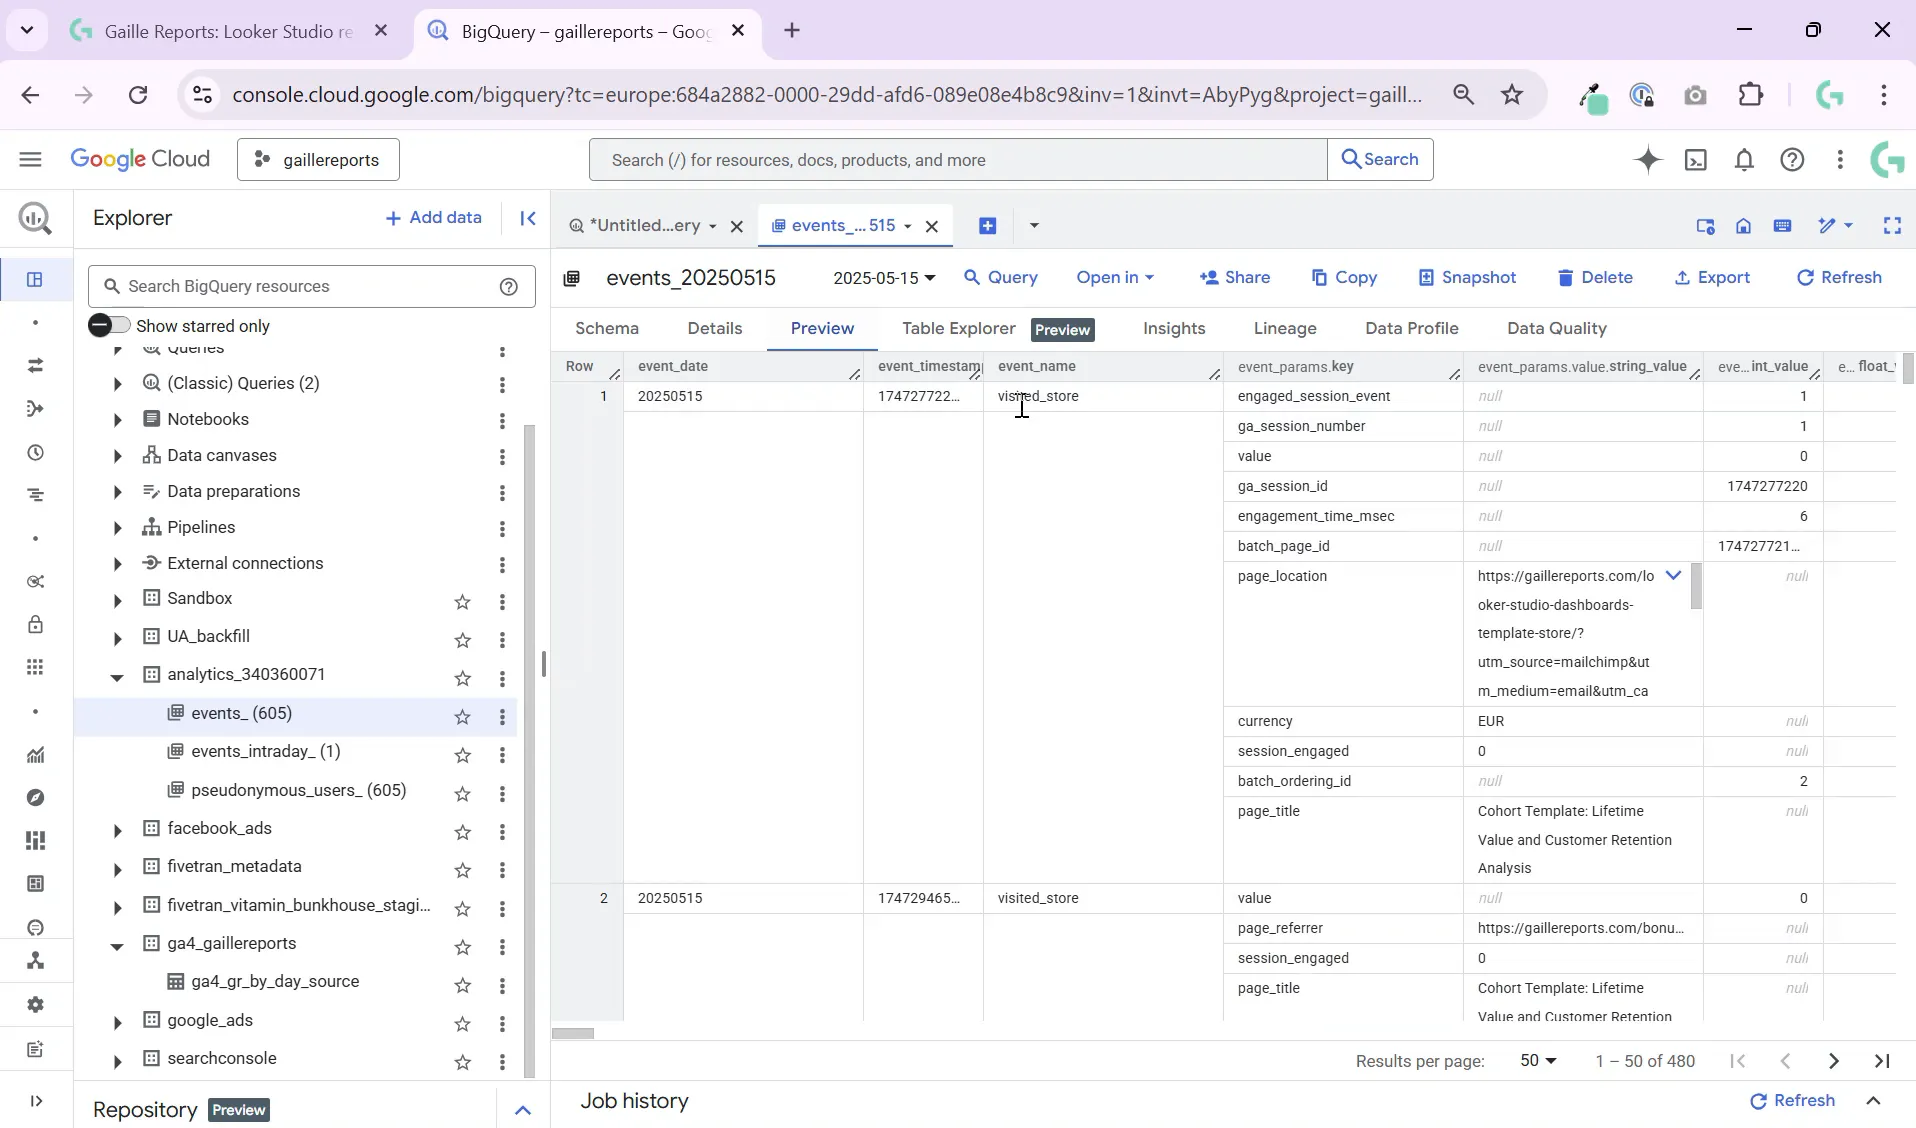
Each row contains fields such as event_name, event_timestamp, and other user or event parameters.
Step 2: Write a Basic Query to Count Events by Name
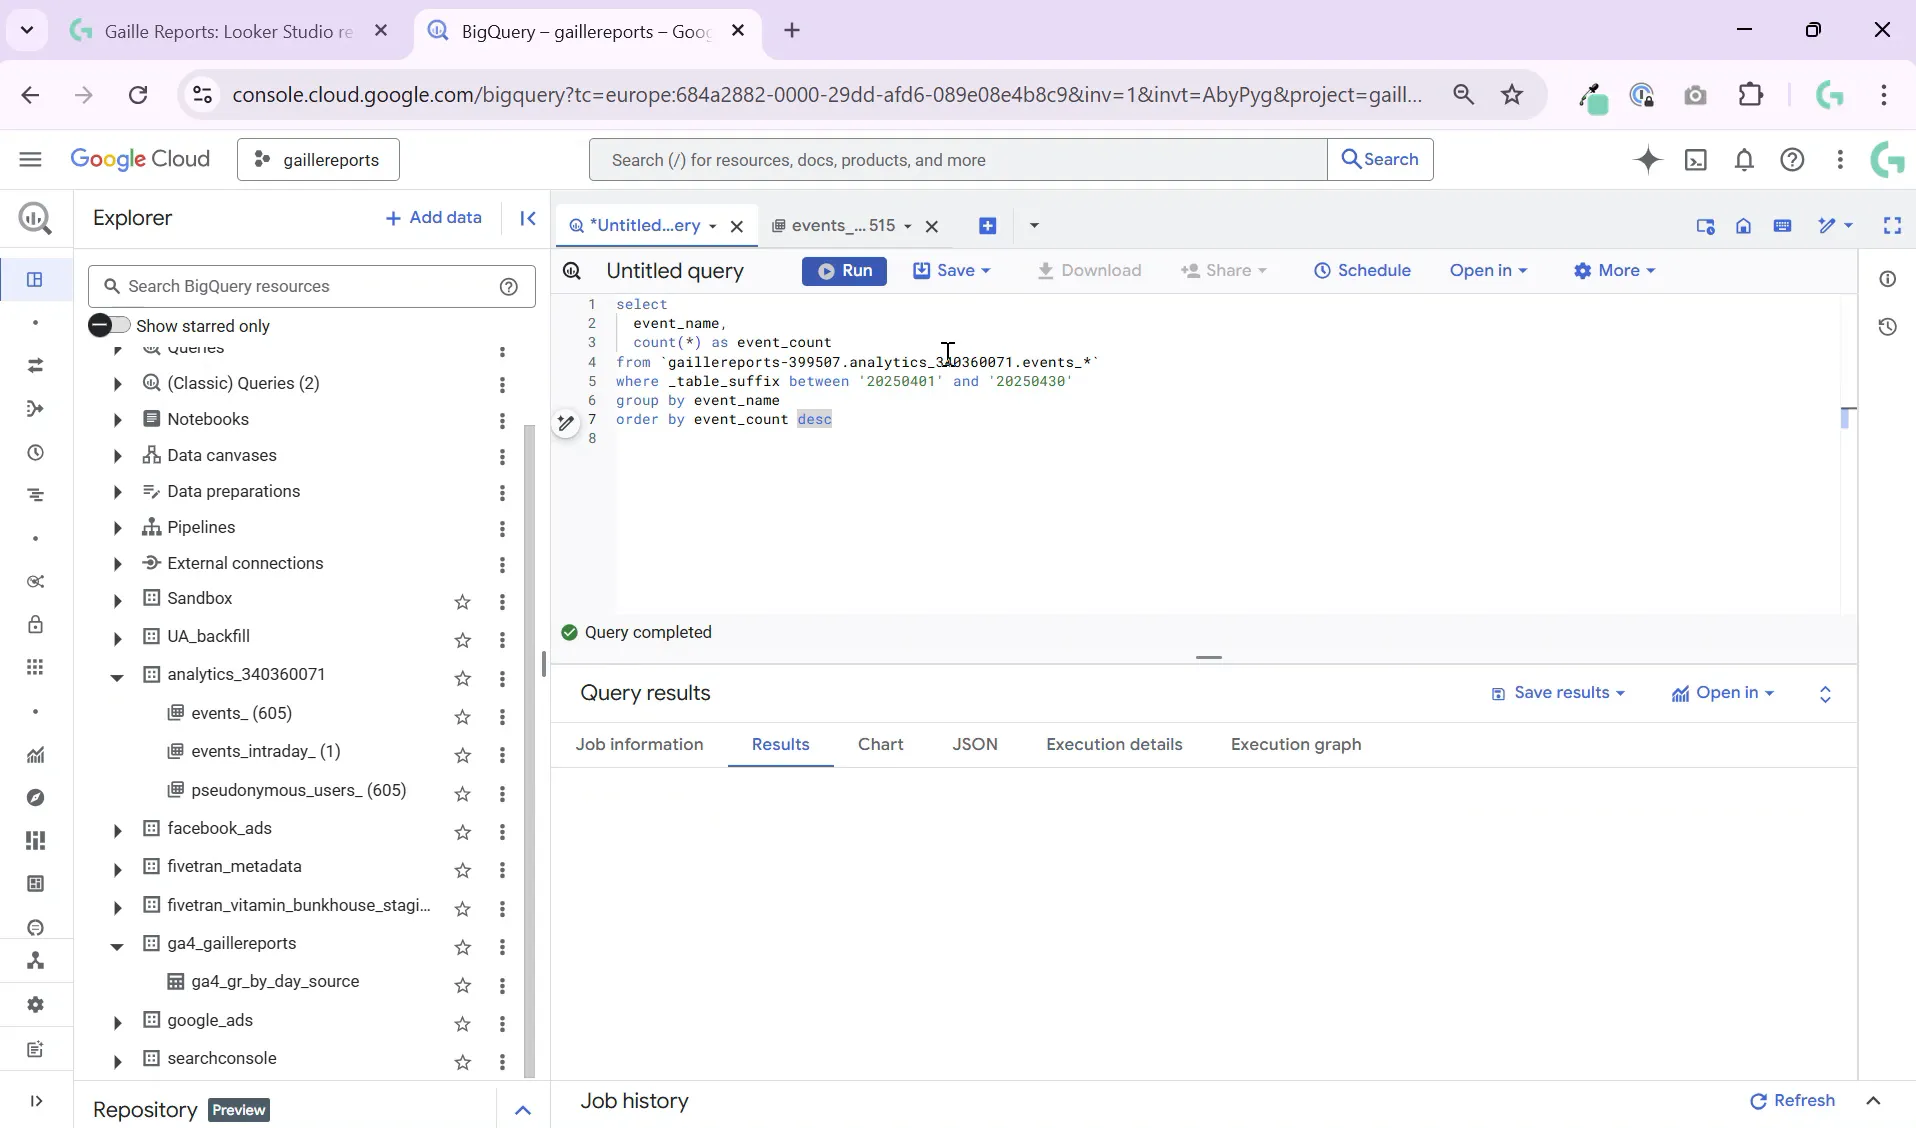
To find out how many times each event happens on your site, you can write a simple SQL query that groups events by their name and counts their occurrences. This is a straightforward way to get a ranked list of event names and their counts.
The basic structure of the query looks like this:
SELECT
  event_name,
  COUNT(*) AS event_count
FROM
  `your_project.your_dataset.events_*`
GROUP BY
  event_name
ORDER BY
  event_count DESC
Let’s break down each part of this query:
- SELECT: Here you specify the columns you want to retrieve. We choose
event_nameto group by event, andCOUNT(*)to count the number of rows (events) per event name. - FROM: This tells BigQuery which table(s) to query. The wildcard
events_*lets you query across multiple daily tables. - GROUP BY: This groups the results by each unique event name so we can count how many times each occurs.
- ORDER BY: This sorts the results by event count in descending order, so the most frequent events appear first.
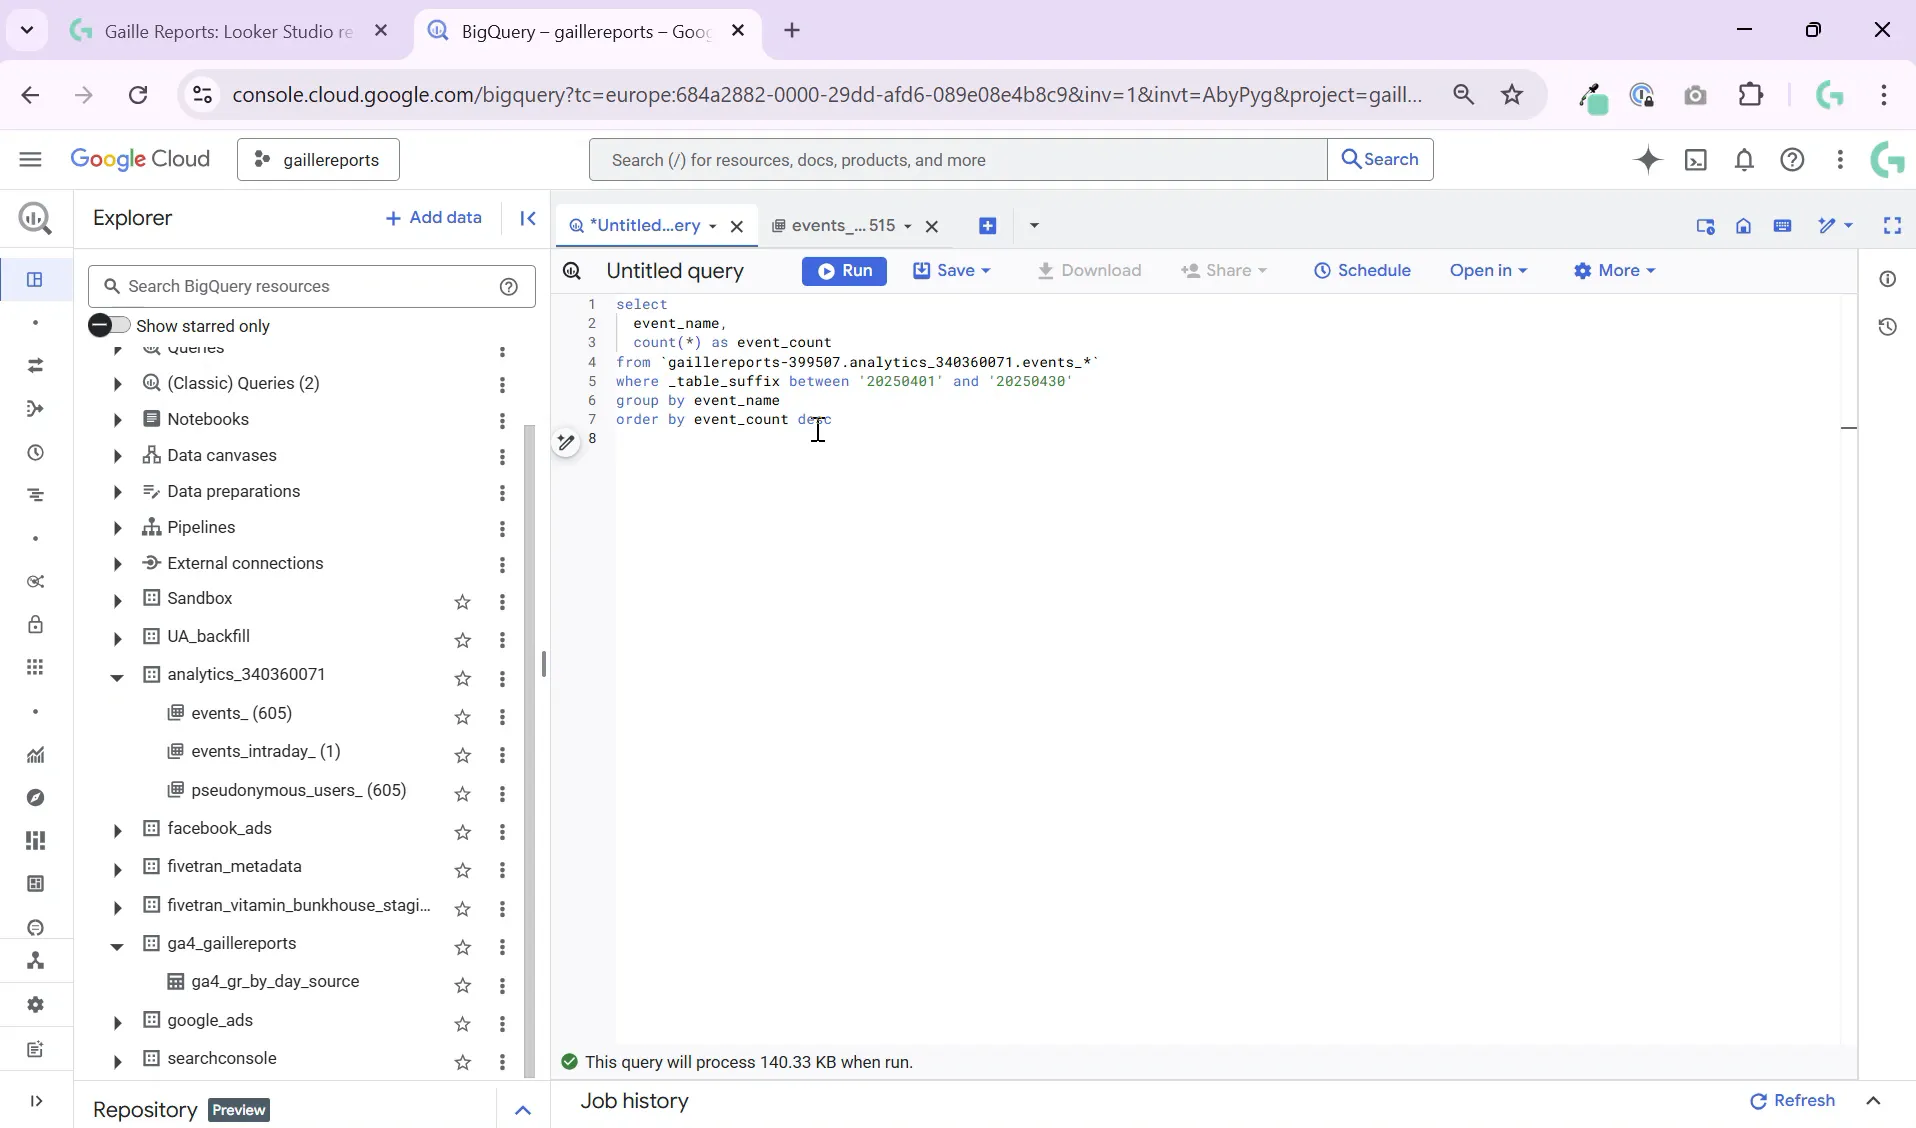
Step 3: Run Your Query and Interpret the Results
When you run the query, you’ll get a table showing each distinct event name and how many times it occurred in the selected time range. This is an excellent way to explore what events GA4 is tracking on your site.
For example, you might see events like page_view, session_start, purchase, and any custom events you’ve implemented. The counts give you immediate insight into your site’s user interactions.
This also helps you spot potential issues such as:
- Events that are missing from tracking.
- Typos or inconsistent event naming.
- Unexpected or redundant events firing too frequently.
Step 4: Customize Your Query for More Insights
Once you feel comfortable with the basic event count query, you can start enhancing it to answer more specific questions. For example, you might want to filter events by date range, user properties, or event parameters.
Here’s an example of filtering events from the last 7 days using the event date field:
SELECT
  event_name,
  COUNT(*) AS event_count
FROM
  `your_project.your_dataset.events_*`
WHERE
  _TABLE_SUFFIX BETWEEN FORMAT_DATE('%Y%m%d', DATE_SUB(CURRENT_DATE(), INTERVAL 7 DAY))
  AND FORMAT_DATE('%Y%m%d', CURRENT_DATE())
GROUP BY
  event_name
ORDER BY
  event_count DESC
This query uses _TABLE_SUFFIX to filter tables by date suffix, counting events only from the last week.
You can also join the event data with user or session data, aggregate by user segments, or calculate event counts per user. The possibilities grow as you become more familiar with SQL and your dataset.
Step 5: Use Your Event Counts to Build Reports and Dashboards
Counting events by name is a foundational step for building marketing analytics reports and dashboards. Once you have your event counts from BigQuery, you can connect these results to visualization tools like Looker Studio (formerly Data Studio) to create interactive dashboards.
Looker Studio allows you to create charts and tables that automatically refresh with your BigQuery data, giving you up-to-date insights into your website’s user behavior.
If you’re interested in learning how to connect BigQuery to Looker Studio for marketing dashboards, check out this tutorial I wrote: How to Connect BigQuery to Looker Studio – Beginner Friendly Tutorial.
Summary: Start Simple, Then Build Complexity Step by Step
Getting the GA4 event count in BigQuery is your first step toward unlocking the power of raw GA4 data for marketing analytics. By writing a simple query that counts events by name, you gain a clear understanding of what’s tracked on your site and can identify any gaps or errors.
Remember these key points:
- Each GA4 event is stored as a row in the
events_*table in BigQuery. - Use
COUNT(*)grouped byevent_nameto get counts of each event. - Order results descending by count to see your most common events first.
- Filter by date using
_TABLE_SUFFIXto focus on recent data. - Explore and customize queries further as you get comfortable with SQL.
This approach is simple but powerful, serving as a solid foundation for more complex GA4 BigQuery analyses.
Want to Learn More?
If you found this tutorial helpful and want to expand your skills, here are some other blog posts you might like:
- How to Connect BigQuery to Looker Studio – Beginner Friendly Tutorial
- Google Sheets to BigQuery Made Easy – No Coding Required
- What’s New in the Looker Studio Update
Keep experimenting with your GA4 data in BigQuery, and soon you’ll be creating powerful, customized marketing reports that drive smarter decisions.
Happy querying!
Leave a Reply