
Blending data source based on Google Analytics 4 in Looker Studio
Data blending is a process in which you mix information from different data tables to make one set of data. In this article I’m going to give you the full image about the blended data join types in Looker Studio. In a previous article about data blending, I showed how all the types of joins work.
Check out the video tutorial here:
Pre-setup
Luckily, in Looker Studio you can pull up data directly from your Google Analytics. To do this, you need to click: Manage Added Data Sources → Add a Data Source. Then you need to find Google Analytics in the list.
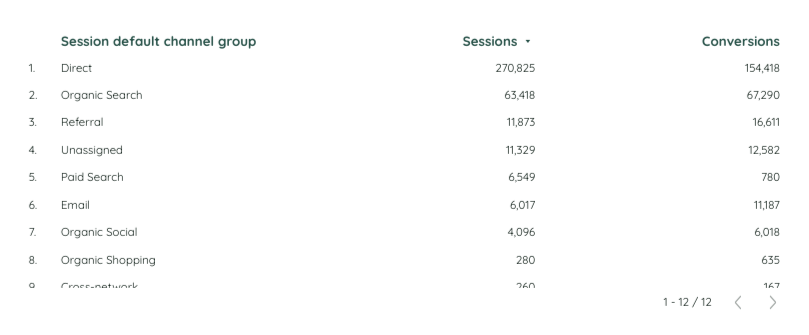
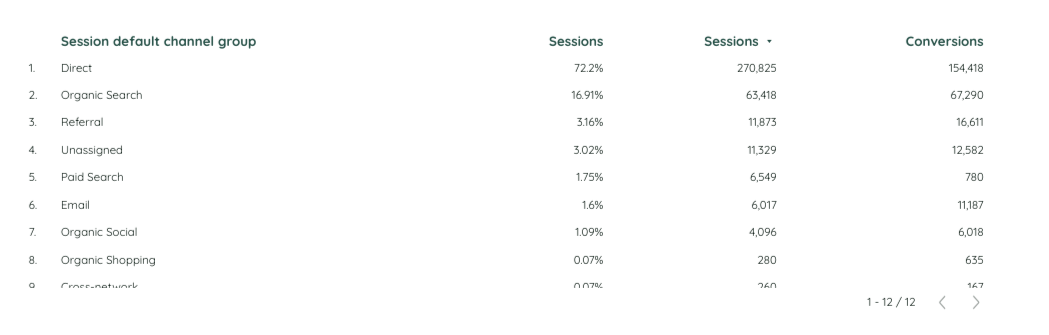
Having added our data source, let’s create a table:
Dimensions: Session default channel group
Metrics: Sessions, Conversions
Sort: Sessions
Creating organic filter
Let’s imagine we work with organic traffic and we need to check out the performance. So, we need to filter our data in order to see only organic traffic data.
How do we create filters?
Having selected the table, in the right panel search for “Filters” →”Add a filter”. Then we have to name it. I will name it GA4 Organic. Followingly, we need to write a condition to filter the data.
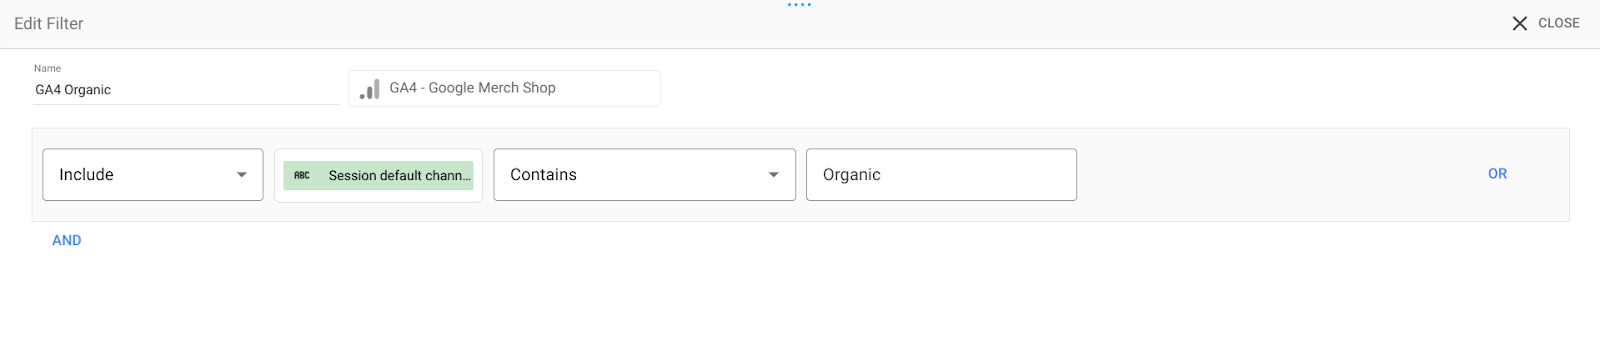
Interpreting the condition in the picture – we will only see Session Default Channel Groups that contain the word Organic.
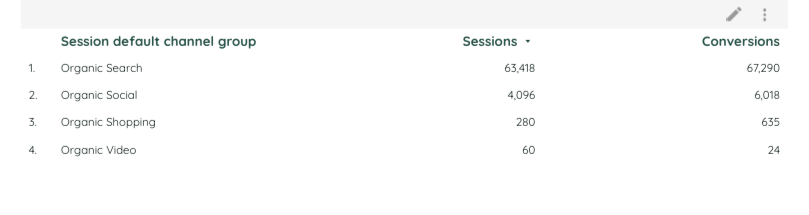
As you can see, filters have turned us the results containing the word Organic.
Counting organic percentage
What should we do if we want to see the percentage of Organic Search of All the Organic traffic data? It’s pretty easy to do.
- Add one more Sessions metric to the table.
- Click Edit
- Change Comparison Calculated from none to Percent of Total
Counting organic traffic share from all website traffic
Now let’s see how organic traffic share from all the website traffic is calculated.
First of all, we need to remove the organic filter. Then we have to create a data blend in the table. So, select the table and in the data source section in the right panel click Blend Data.
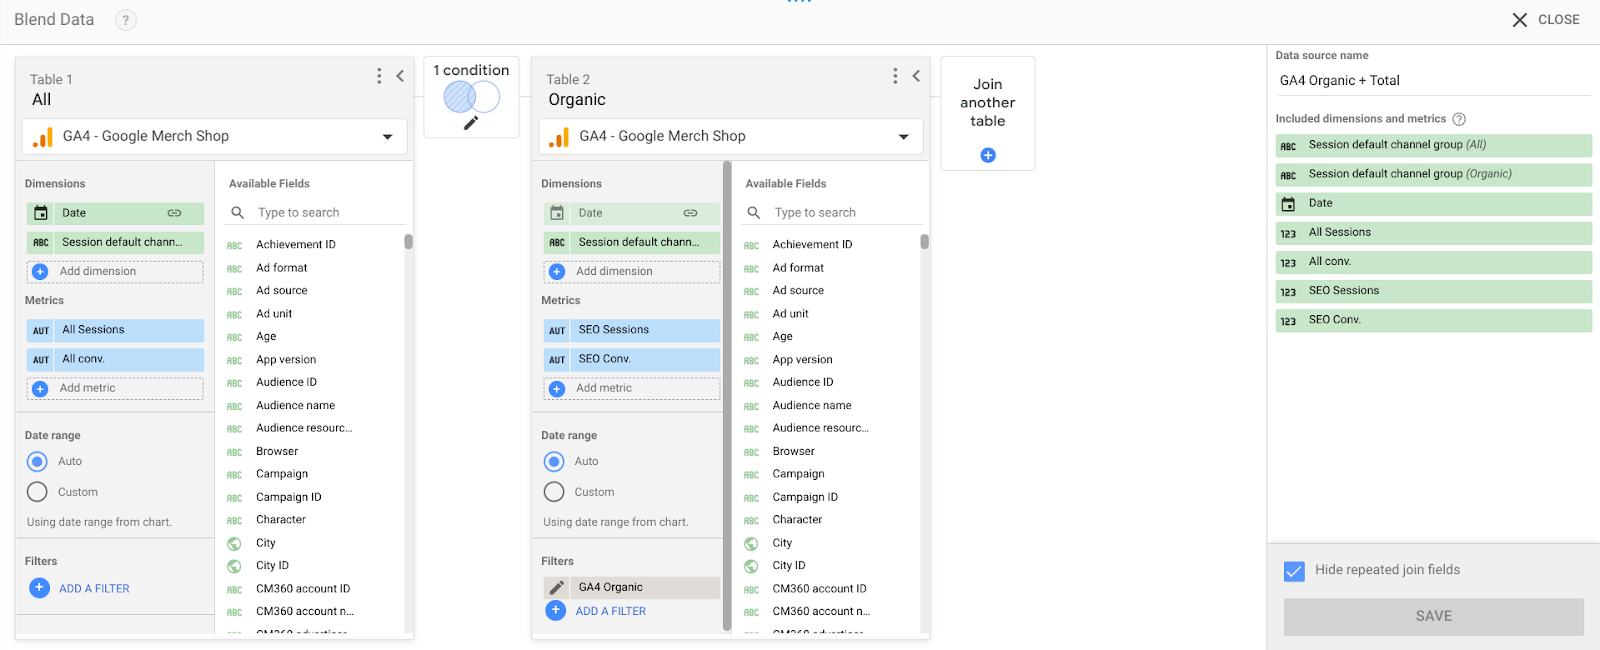
Our first table is going to be “All” and the second table is going to be “Organic”
Let’s add the metrics Sessions and Conversions for both of the tables and rename the fields in order not to get confused. The ones in the first table are going to be “All sessions” and “All conv.” and in the second one – “SEO sessions” and “SEO Conv.”
In the second table, we need to add our GA4 organic filter. As a join let’s select Left Outer Join. If you want to know the difference between all the types of joins, check out this article.
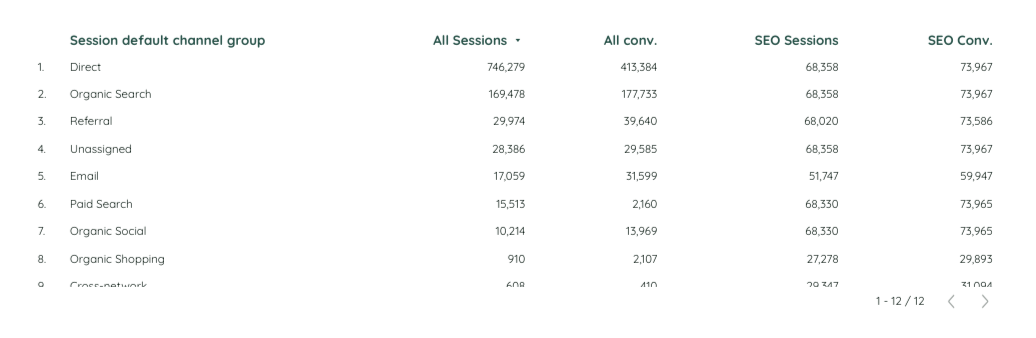
Here is what our table with blended data looks like.
Based on this data we can create scorecards.
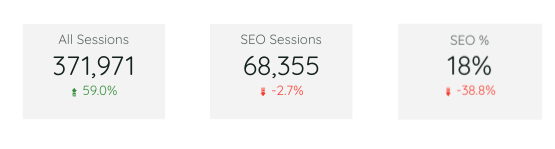
To create the first one, we just need to select All Sessions as a metric.
Likewise, to create SEO Sessions we need to select a corresponding metric. However, we can upgrade it using a formula IFNULL (SEO Sessions, 0), and change its format to a number.
SEO % is created using a formula SEO Sessions / All Sessions. Here you will have to change the display format and data type to Percent.
NOTE: if you use Google Analytics connector to Looker Studio, the numbers won’t always be accurate. But if you pull up data to BigQuery first and then to Looker Studio, this is how you avoid inaccuracy.
However, in our case the inaccuracy can be fixed by just deleting Session Default Channel Group from the dimensions in the blended data source.
TIP: before undertaking measures to solve the errors and getting confused because something doesn’t work as it should, try refreshing the page. Looker Studio sometimes works weird when it comes to blended data.
Summary
Data blending in Looker Studio is a very useful feature because it allows users to combine data from multiple sources into a single report, enabling more comprehensive and insightful analysis. This feature helps in creating a unified view of disparate data, facilitating better decision-making by correlating different datasets and uncovering trends that may not be evident when viewed separately.
If you work with organic traffic, you may like our Google Analytics 4 and Google Search Console SEO report. It’s an easy-to-use report containing popular and landing pages, device and geographical overviews, organic traffic performance analysis. As this report is based on GA4 and GSC, you can try out data blending and tricks I’ve told in the article about.
If you have any questions about data blending – feel free to ask in the comments section!