
How to Blend Google Analytics 4 and Search Console Data in Looker Studio

Google Analytics and Google Search Console are two of the most popular services for marketing analytics. When combined, they give you a full image of the most important metrics and the performance of your business.
Check out the full the video:
Pre-setup
First of all, we have to connect the data sources to the dashboard.
- Click “Resource” menu
- Select “Manage added data sources”
- Click “Add a data source”
- Connect Google Analytics and Google Search Console
Here are the datasets we have from these sources.
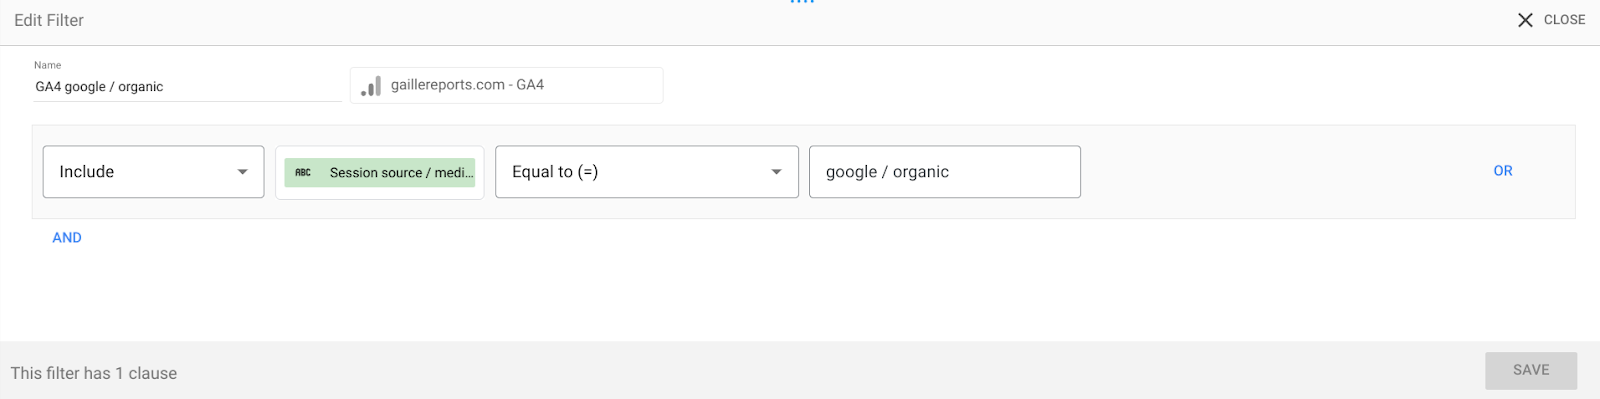
Let’s apply an organic filter to the Google Analytics table to show only google organic traffic data.
The condition is the following: In the Session source/medium column only the rows containing “google / organic” need to be presented.
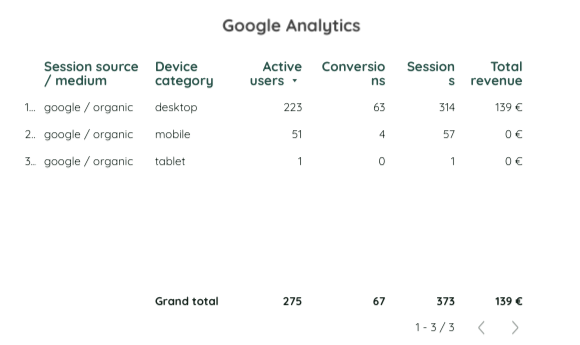
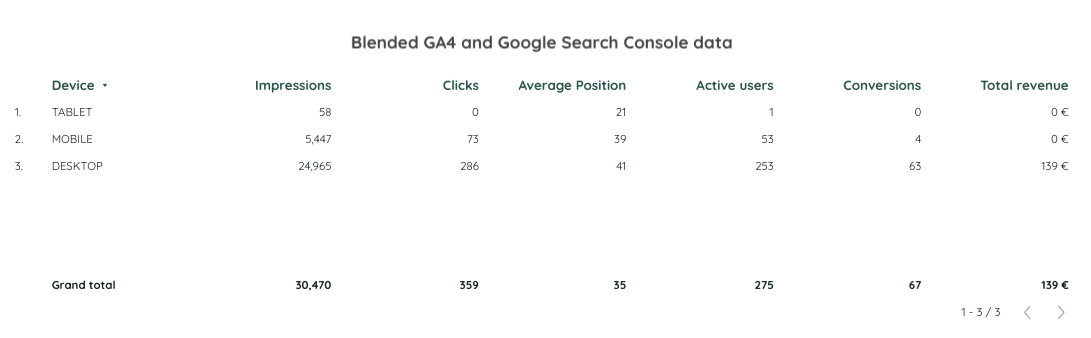
In result, our table starts to look like this:
Why creating a blend with Google Analytics and Google Search Console data may be useful?
For example, if you need to create a funnel “Impressions → Clicks → Active users” etc., you can easily make it using a blended data source. Each of the data sources does not contain full information and when combined they complement each other perfectly, showing you full data.
What are our steps now?
We create a table based on a certain data source, and we will have to transform that table into a table with blended data.
Let’s select GSC as a data source. Taking a look at our primary tables, you may notice that we have device categories in both of the tables.
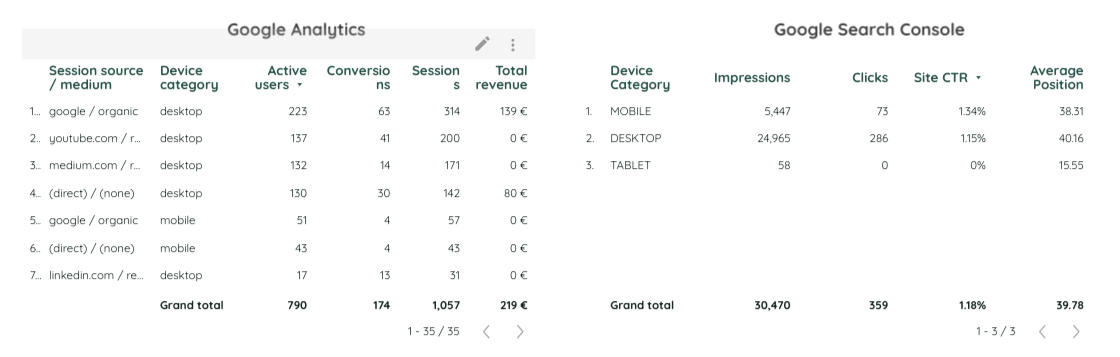
But the problem is that in GSC it’s shown in capital letters and in Google Analytics – in lowercase.
Creating a blend
Google Search Console will be our left table and Google Analytics will be the right one. We are going to blend data based on data and device category fields. So, they need to be present in both of the tables. The type of join is a full outer join. If you don’t know the differences between the joins, you can read our article with all the data blending joins explained.
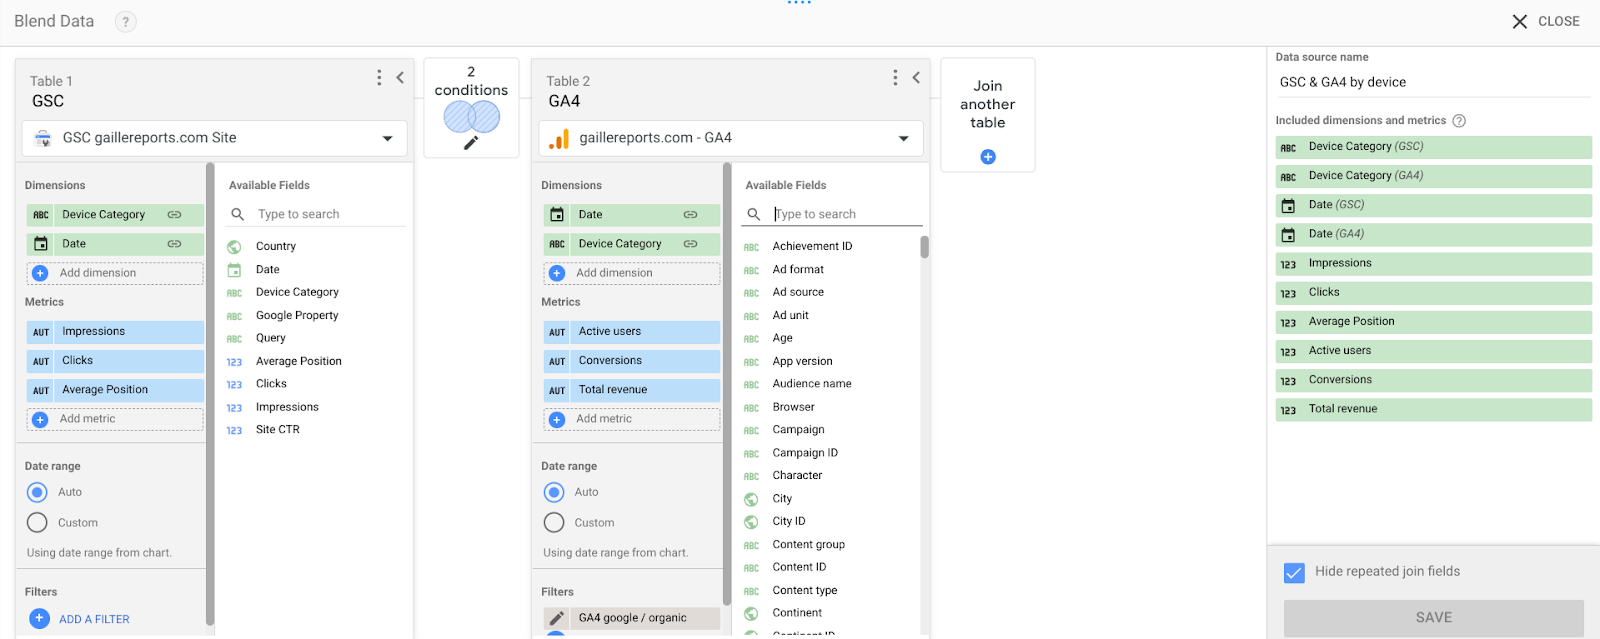
Also, we need to add a filter to GA4 table so that we could see google organic data.
You can see the other settings in the image.
Next thing we have to do is create a one single way to present the names of device categories. Thus, in blended data GA4 table, we should edit device category field with a formula:
UPPER (Device Category)
This formula will capitalize all the device category names, and now the data from both of the tables will be shown in uppercase letters.
So, one challenge is solved. Another challenge is to avoid “null” rows in the blended table.
It happens very frequently when using a full outer join while blending data. You can easily fix it with a formula which in our case is going to look like this:
IFNULL (Device Category (GSC), Device Category (GA4))
Tip about calculated fields
Blended data gives as a mount of possibilities to add extra calculations. For example, you can add a CTR to the table using a formula:
sum(Clicks)/sum(Impressions)
When you need to add any calculations, you have to do it directly in the final table and not in the data blend settings.
Summary
In Gaille Reports template store we have a great SEO report template based on GA4 and Google Search Console data. It’s exactly the case when you can improve the dashboard by merging GA4 and GSC data.
Hope you liked the article! If you have any questions about blending data, share them in the comments section, I will be glad to help!