
B2B Paid traffic leads Looker Studio report template overview
This report was created to let B2B directors see their leads and, particularly, paid traffic leads. It will be truly relevant for B2B’s with a little number of leads but expensive ones, for example for lawyers, higher education providers or luxury trip agencies. In other words, companies with long sales will find this B2b Paid traffic leads report really useful.
Keep up with the video overview of this template:
General Looker Studio overview
This report consists of 11 pages. The first page is the title of the report and the second page, consequently, is about budget. Then, the rest of the pages are dedicated to leads and campaigns – all channel leads, leads by channel, leads by ads platform and ads platform campaign overviews. Let’s start with a budget page overview.
Budget overview
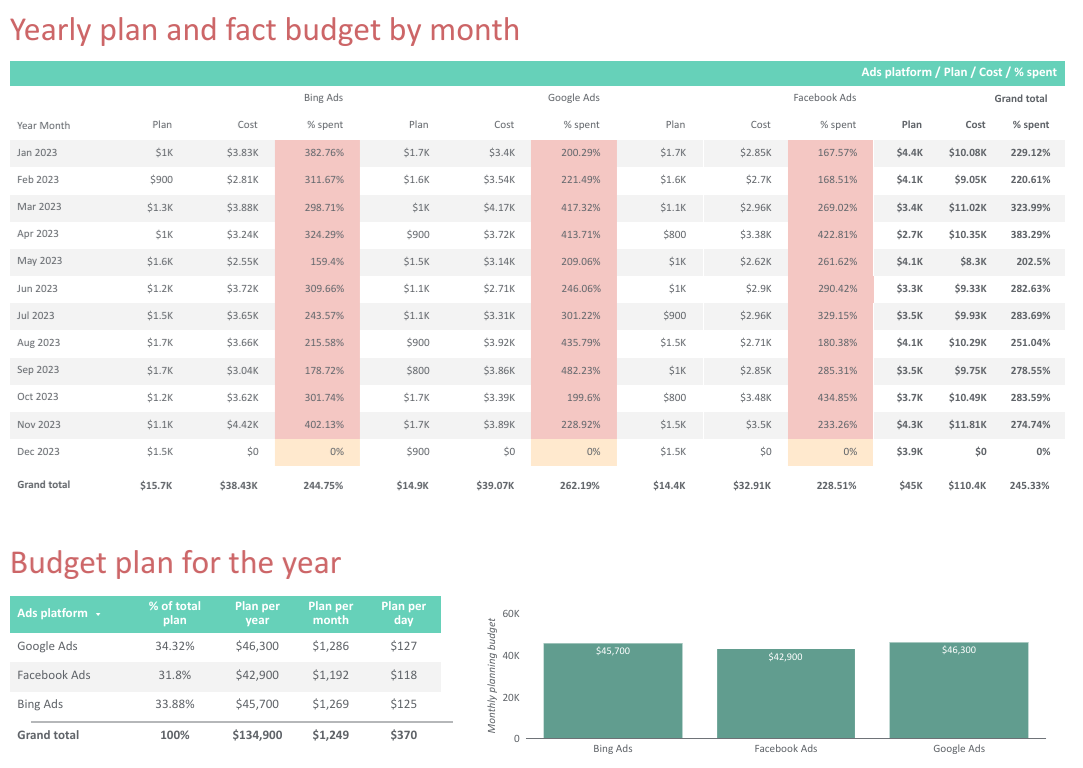
The page is called “Total year budget”.
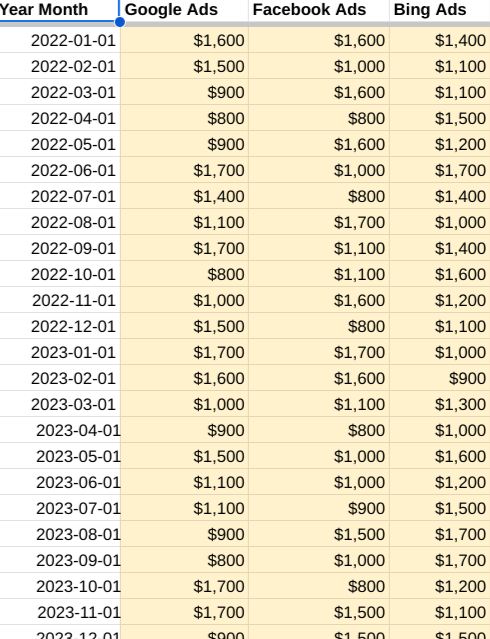
Firstly, there is a plan-fact budget by month overview. As you can see, this table contains data from Bing Ads, Google Ads and Facebook Ads. When you set up your template, you have to use your ads platforms – they can be more or less than in my case.
Each ads platform section consists of plan, fact and the percentage of budget spent. In the end we have a Grand Total. Analyzing it, we can say that we were spending twice – sometimes three times more – than was planned.
Then we can see a budget plan for the year for each ads platform – percentage of total plan, plan per year / month / day. This table will be surely useful for the ads manager who sets up the campaigns.
Total leads
In this page of the report we get a profound understanding of total monthly leads analytics.

We can see the score boxes with the number of clicks and the comparison with the previous period, cost, cost per click, number of leads, CR to Leads percentage and CPL. Followingly, we have a table with total leads throughout the year divided by months. You can see all the KPIs results for each of the months. Then there is a chart, with the progression of the number of leads.
Leads by channel
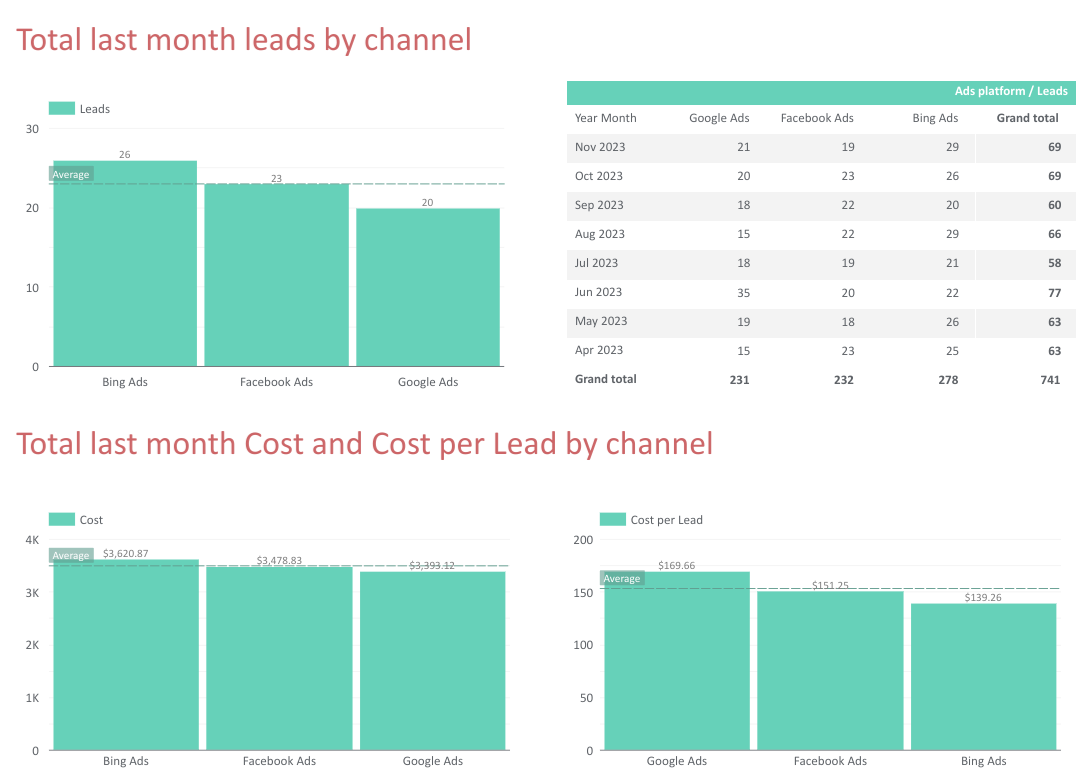
First of all, on this page we can see several charts that show us the leads, cost and cost per lead split by channels. As you can see, I have added to each chart a line that shows the average significatives. This data will be useful to see what ads platform performs the best. Analyzing three of the charts, beside the table, we can see that the biggest number of leads has come from Bing Ads even though the cost per lead form Bing Ads is the least.
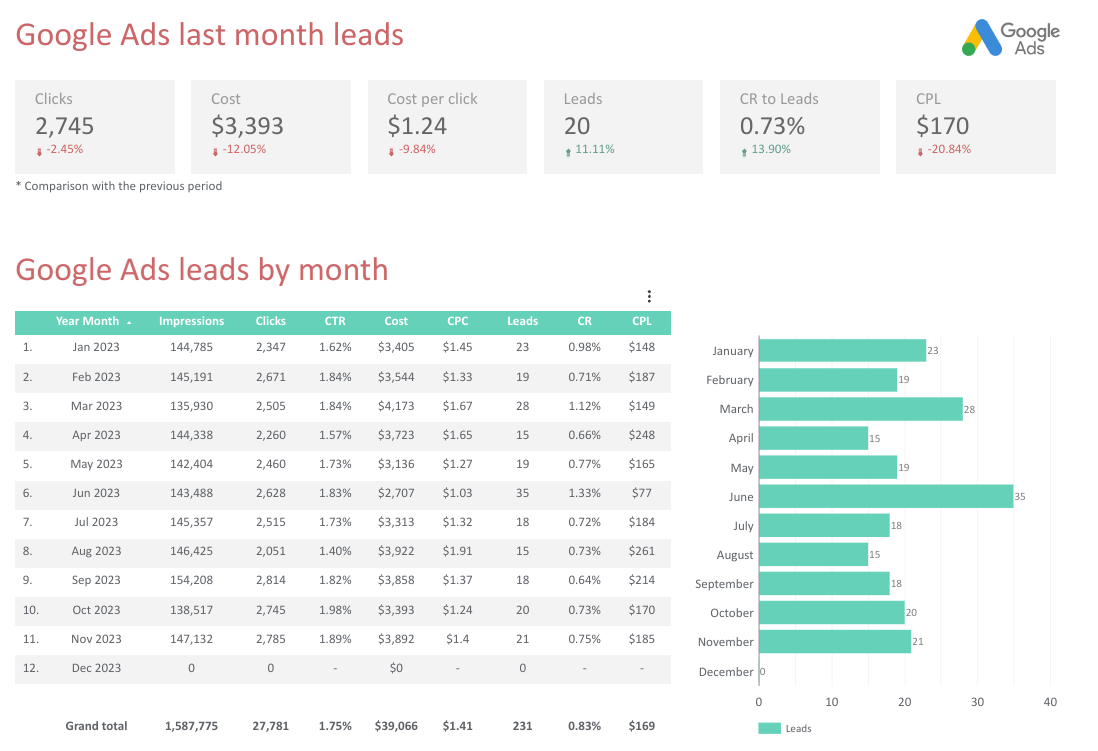
Google Ads Leads overview
Here we can see a page similar to the “Total Leads” page, but this one is dedicated to Google Ads Leads overview. We have the report’s main KPIs – clicks, cost, cost per click, leads, CR to Leads and CPL. Then there is a table with detailed month by month data and a chart to show the quantity of clicks each month.
As we have 3 ads platforms, the three pages with Ad Platform leads overview will look the same. Let us move on to the Ad Platform campaign page.
Facebook Ads Campaign overview
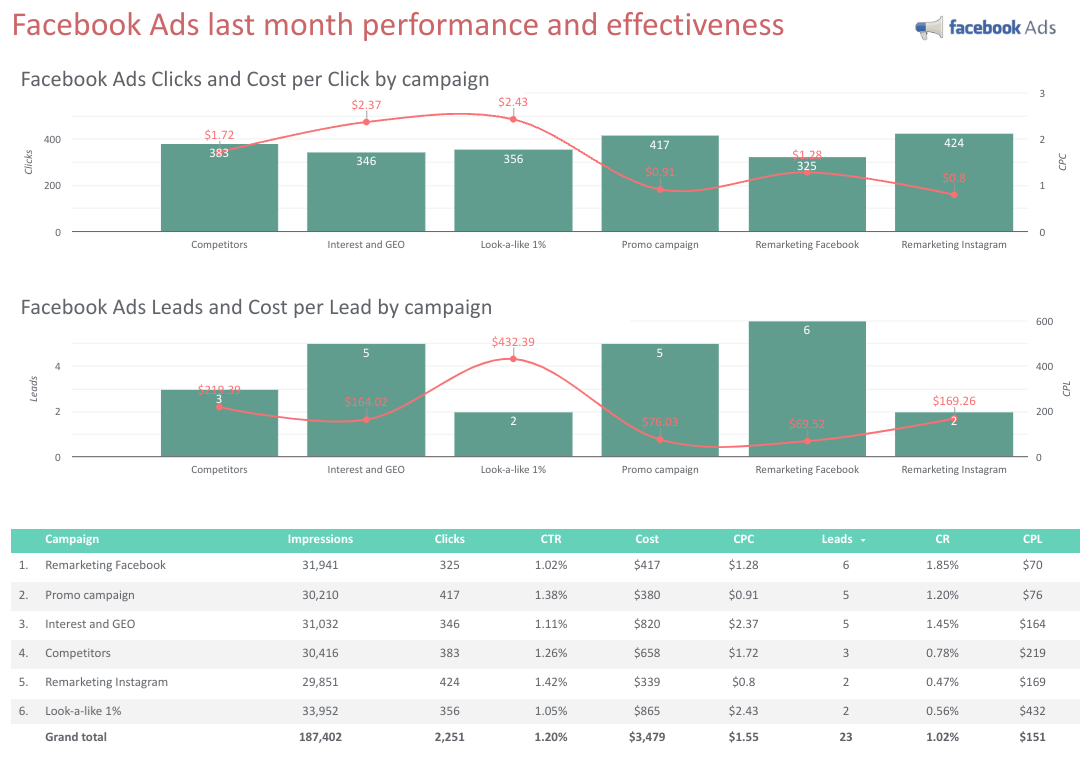
Here is what this page looks like. Basically, we have two bar charts – the first one shows the number of Facebook Ads clicks (bars) and cost per click (dots on the line) meanwhile the second one, similarly, shows the number of Facebook Ads leads and a cost per lead.
Then we have an auxiliary table that truly helps you get a profound understanding of your campaigns, as it has all the most important metrics. For example, Impressions, Clicks, CTR, Cost, CPC, Leads, CR and CPL.
Instagram overview
The last but not least page of this report is dedicated to Instagram overview.
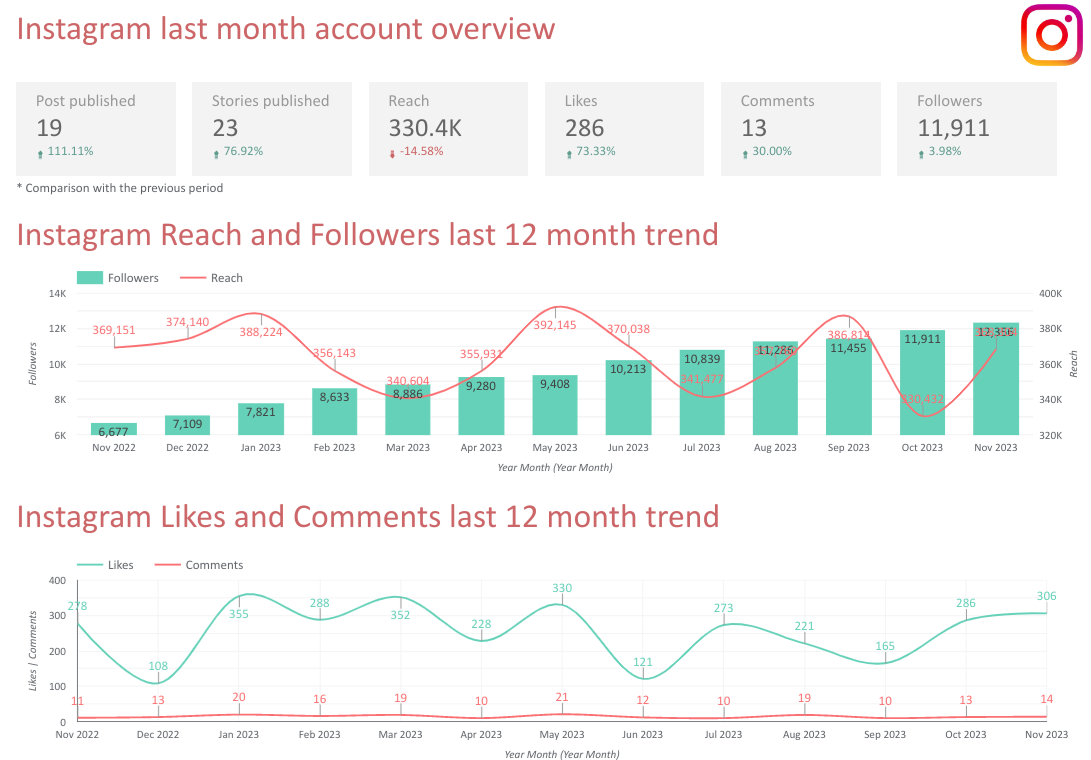
The main KPIs in this section are Post published, Stories published, Reach, Likes, Comments, Followers. Then, there are two charts where we can see the last 12-month trend – the first chart shows the comparison of the number of followers and reach, and the second one – the comparison of the number of likes and comments.
If you don’t have Instagram, you may not use this page – you can simply hide it or delete it.
Data Sources overview
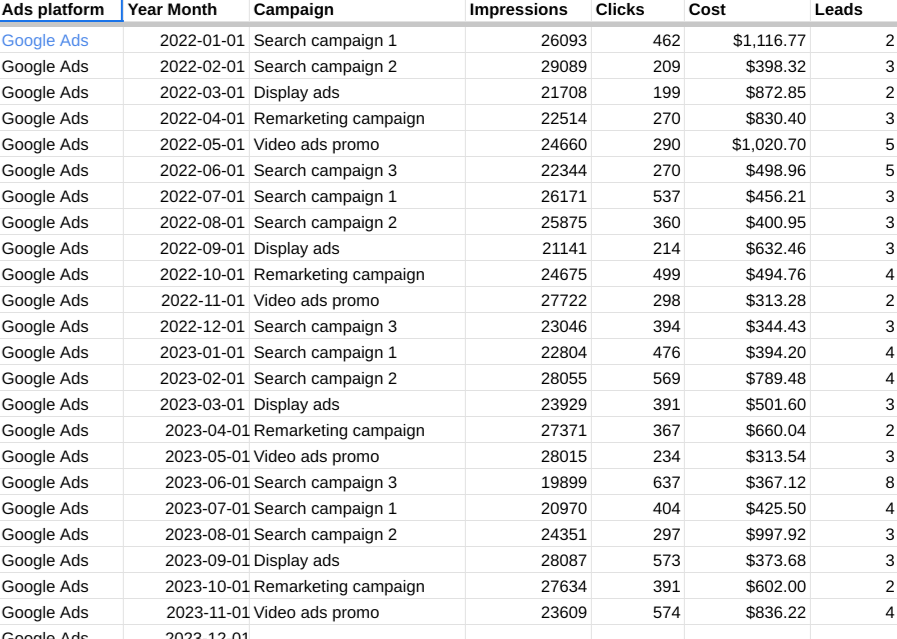
B2B Paid traffic leads report template was built based on 3 Google Sheets tabs. Let’s peek into the data source of the report – the file you receive to set up after the purchase.

The first page of the report is a “Help” page that contains all the instructions about the setup. Which data you need to update, what fields to leave as they are or change – everything you can find here. Besides that, in this tab you can change the ads platforms and the data range.
You need to fill in all the yellow cells with your data. For example, in Google Ads you can create a report in .csv format that will provide you all the data and you just need to insert it to the Sheets. However, if you need to update the data daily, I recommend you to use some connector services that will do it automatically.
There are tabs where you don’t need to make changes and these tabs are connected to Looker Studio.
When you purchase the template, you will get the configuration link and you will need just to copy the Looker Studio dashboard and then you can customize it however you want – replace my logo with yours, change the colors of the report.
You can buy this report template in my store by the link. Also, we provide services of individual design and branding as well as report customization up to your needs. Just contact us, purchase the service, tell us how you want this dashboard to be and that’s it – we will do everything you want!
Hope you enjoyed this template overview! Share your impressions in the comments section!