
How to Analyze GA4 Users by Channel in BigQuery – Full Guide for Marketers

If you’ve recently set up GA4 export to BigQuery, you might be wondering how to create meaningful reports from the raw data. This tutorial will walk you through building a clean, actionable table of active users by day, including source, medium, and channel grouping—all ready to use in Looker Studio for your marketing analytics.
If you’d like to follow along with the video tutorial, you can watch it here:
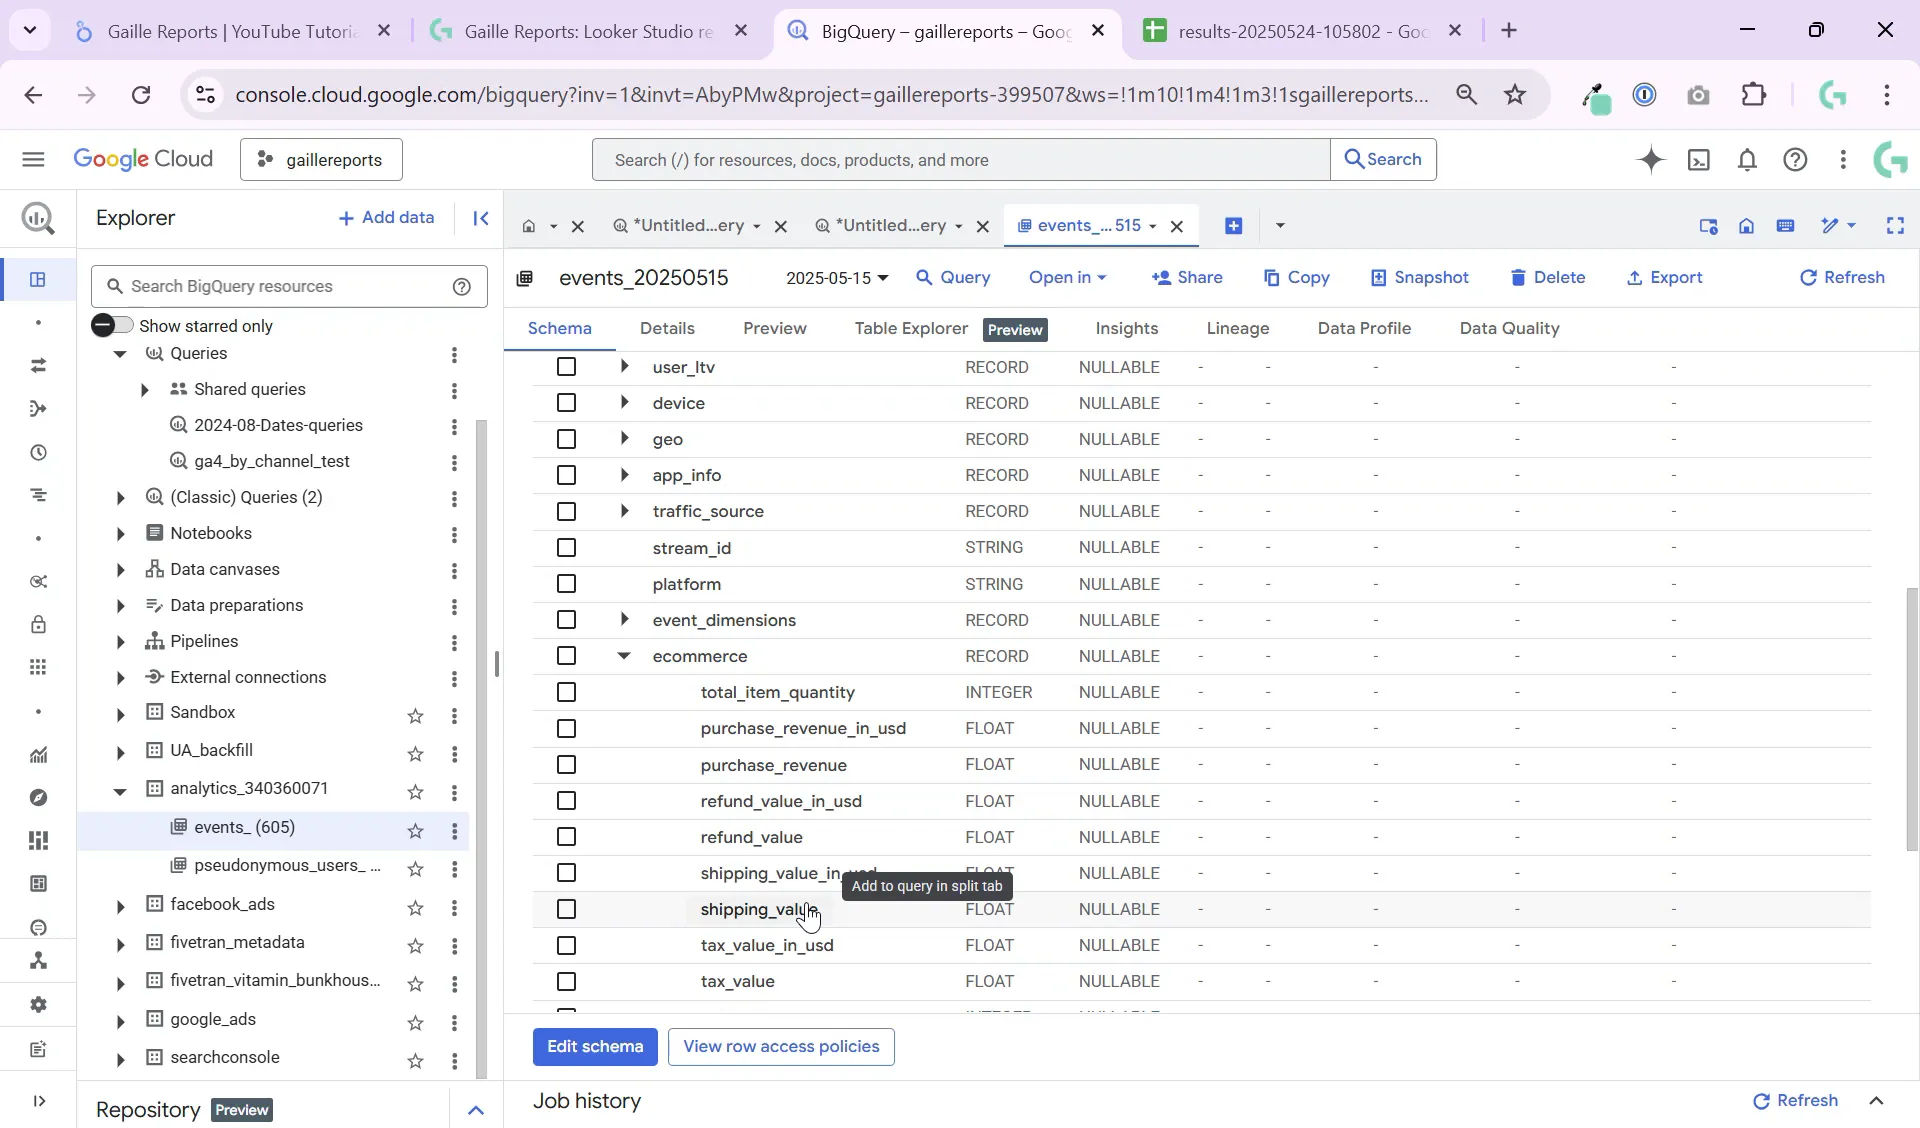
Step 1: Understanding the GA4 Export Data Structure in BigQuery
First, let’s get familiar with how GA4 data is organized in BigQuery. When you export GA4 data, it lands in a dataset with tables partitioned by date. Each day has its own separate table, which helps improve query performance and reduce costs.
The main folder you’ll work with is the events folder. This contains all the events happening on your website or app, such as session start, purchase, scroll, or button clicks. Each event has:
- event_date — the date of the event
- event_name — the type of event, e.g., “session_start” or “purchase”
- event_params — an array of parameters for each event, with key-value pairs (k and value)
- user_pseudo_id — a unique identifier assigned by GA4 to each user
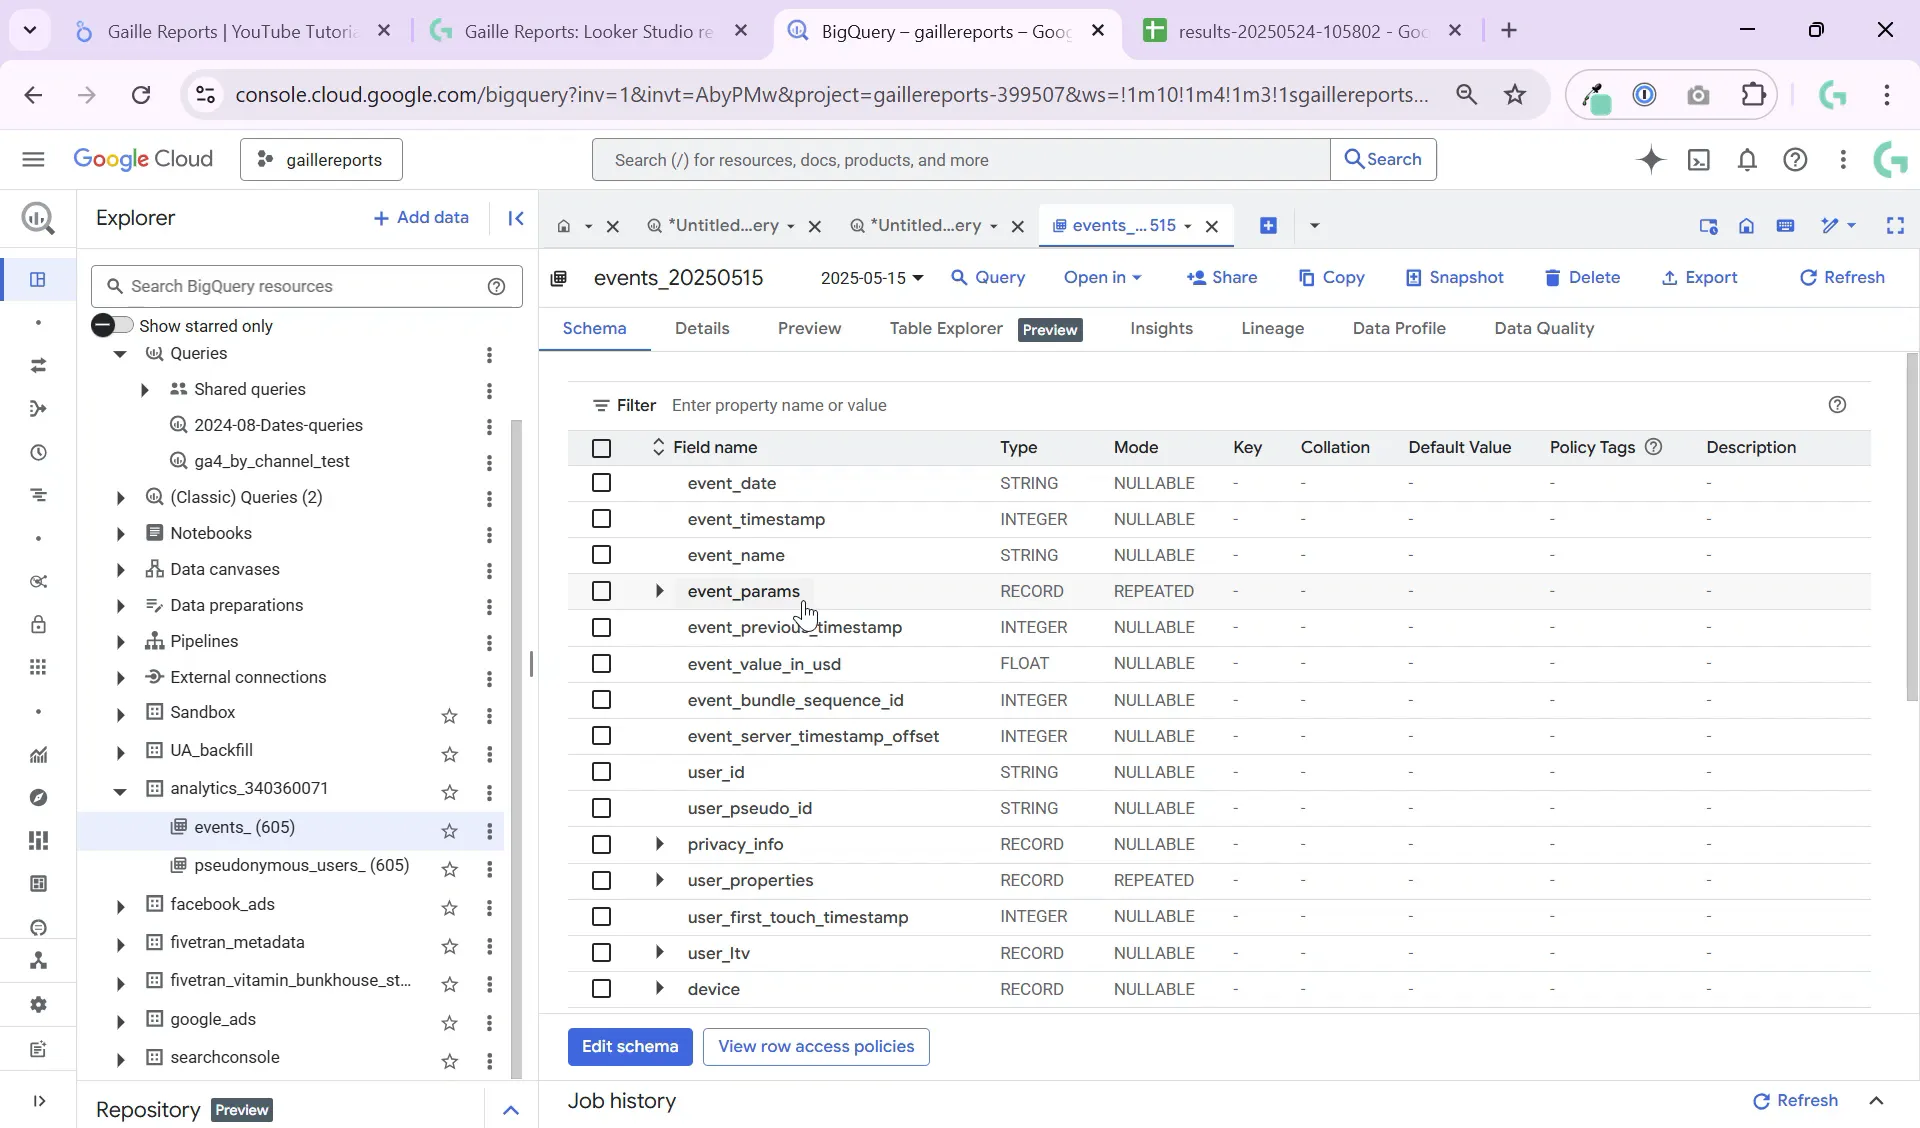
Each event can have parameters like session number, session ID, page location, or engagement time. These parameters are essential for building detailed reports.
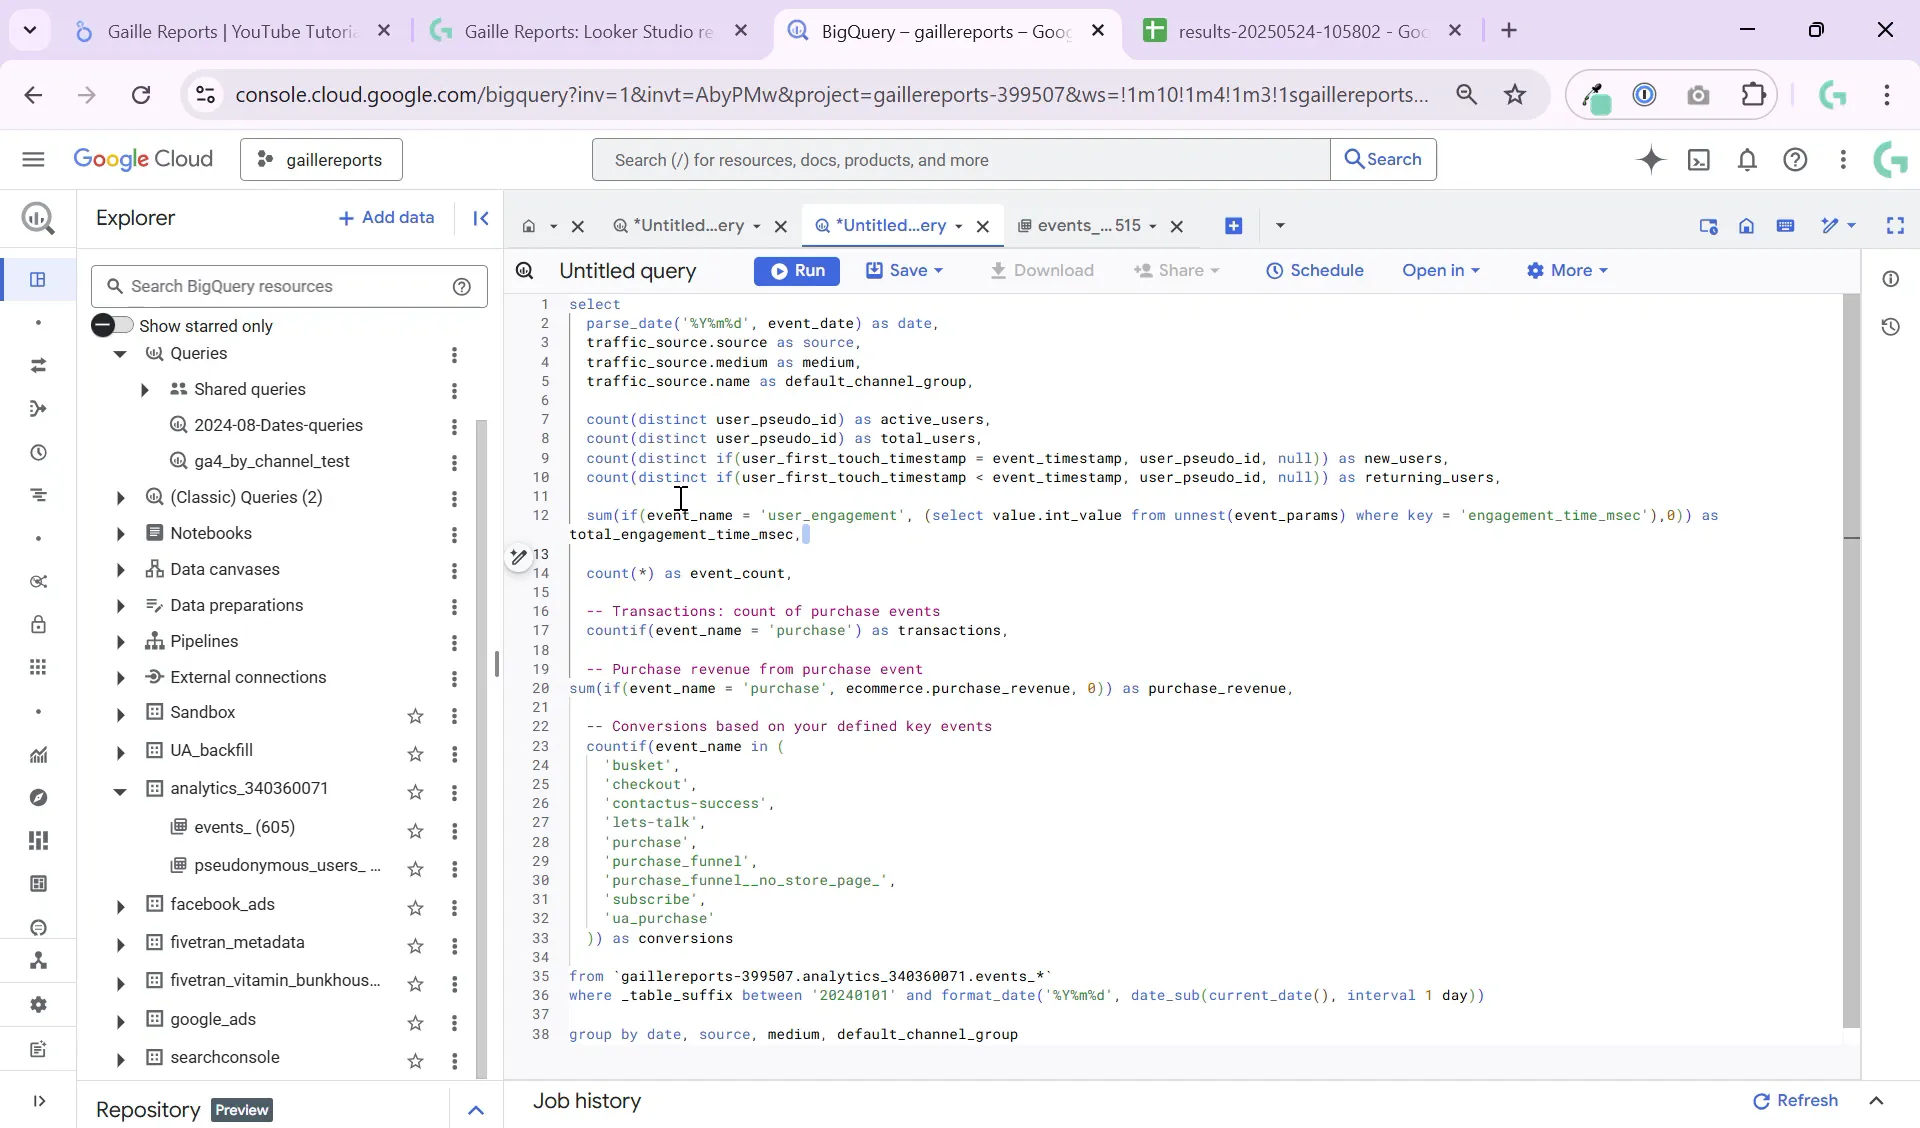
Step 2: Preparing Your Query to Extract Key Metrics
To create a useful table for Looker Studio, we want to extract metrics such as active users, new users, total engagement time, transactions, and conversions—all grouped by date, source, medium, and channel.
Here’s a breakdown of the key fields to include in your query:
- event_date: The date of the event, which you’ll parse into a proper date format since it’s stored as a string.
- source, medium, default_channel_grouping: Traffic source info from
traffic_sourcefields. - active users: Count distinct
user_pseudo_idto get unique users. - new users: Identify if the event timestamp equals the user’s first touch timestamp to find first-time users.
- total engagement time: Sum engagement time from event parameters when
event_name = 'user_engagement'. - transactions and purchase revenue: Count purchases and sum revenue from ecommerce parameters.
- conversions: Count specific events you define as conversions.
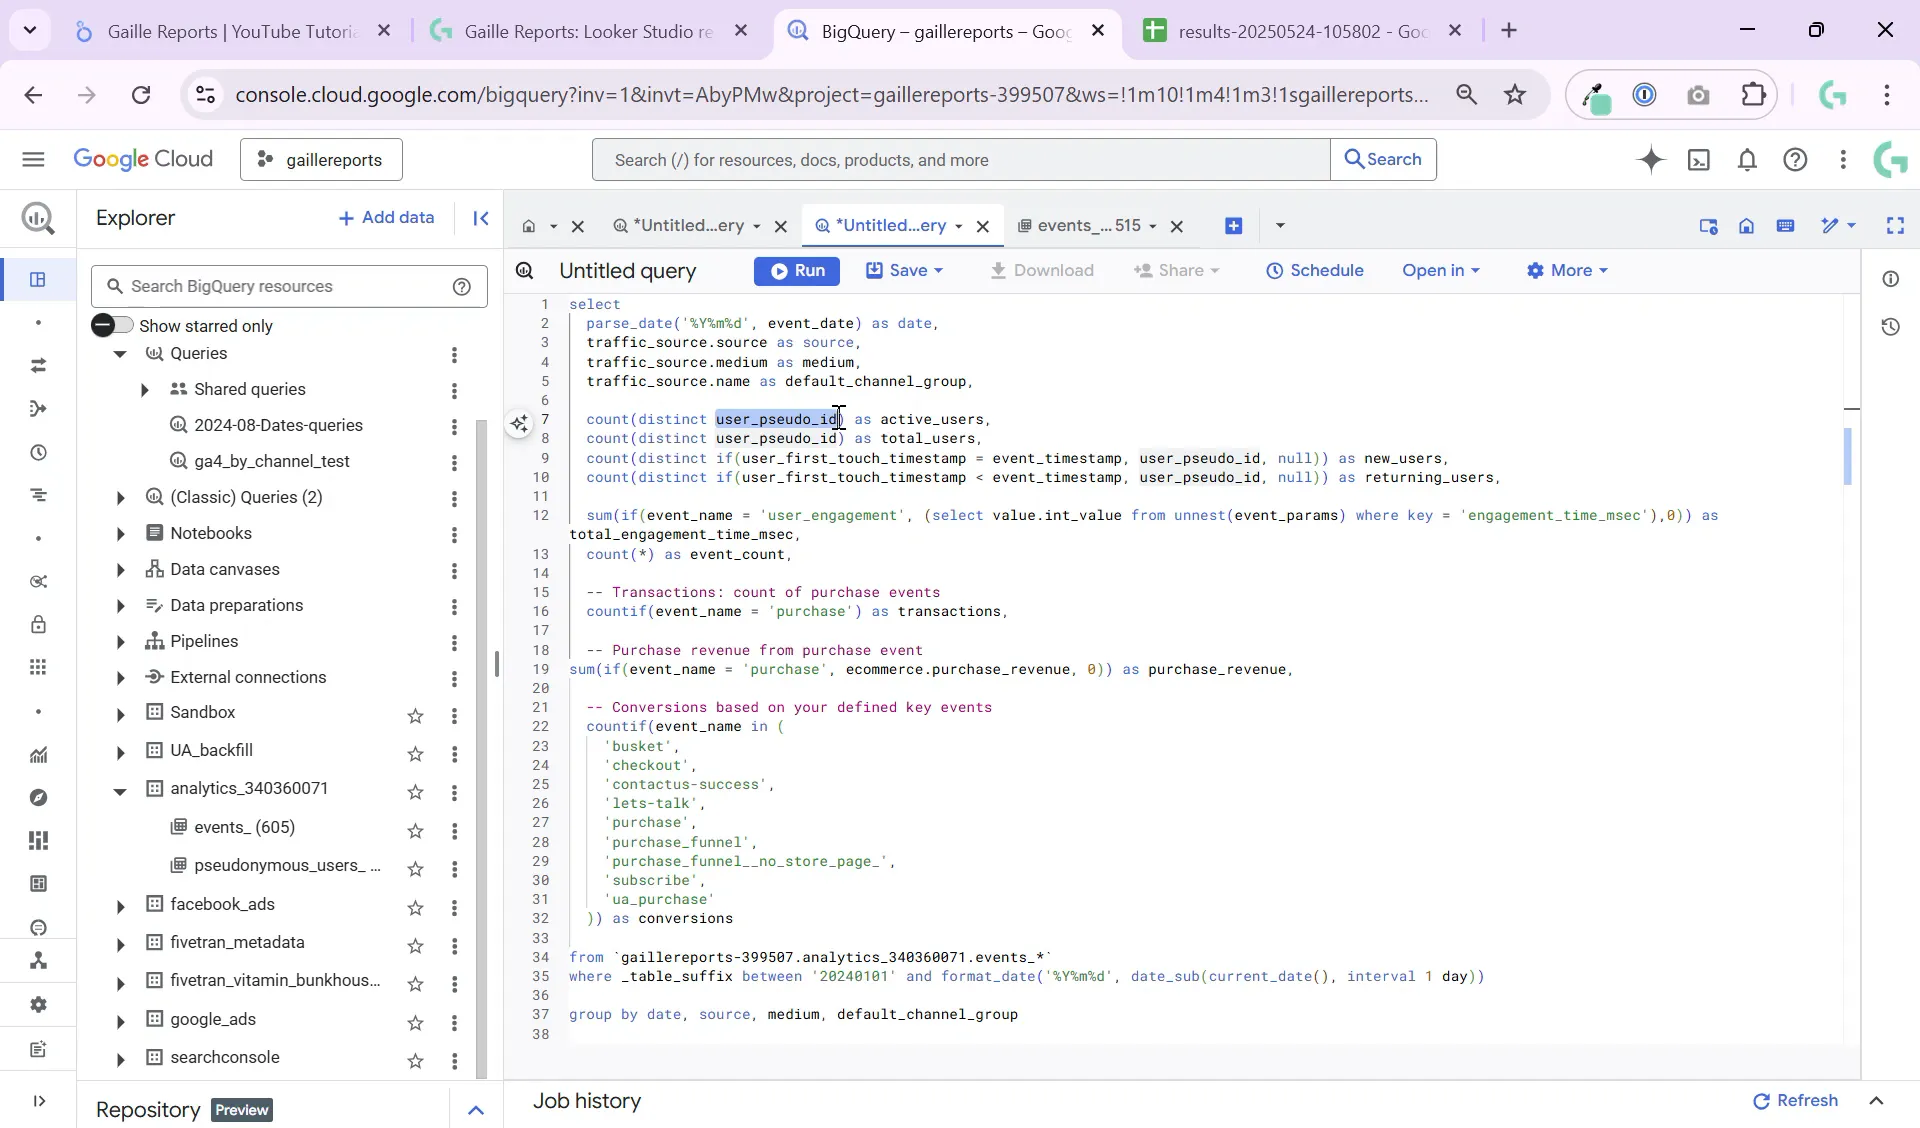
Grouping by date, source, medium, and channel is crucial. Without grouping, you’ll end up with a huge table full of individual events, which is hard to analyze and costly to query.
Step 3: Writing the Query – Parsing Dates and Using Table Suffixes
In BigQuery, you’ll want to query multiple daily tables efficiently. Use _TABLE_SUFFIX to filter data by date range. For example, to query from the start of 2024 until yesterday, you can use:
WHERE _TABLE_SUFFIX BETWEEN '20240101' AND FORMAT_DATE('%Y%m%d', DATE_SUB(CURRENT_DATE(), INTERVAL 1 DAY))
Since event_date is stored as a string, parse it into a proper DATE type using PARSE_DATE() with the format '%Y%m%d'. This makes it easier to group and filter your data.
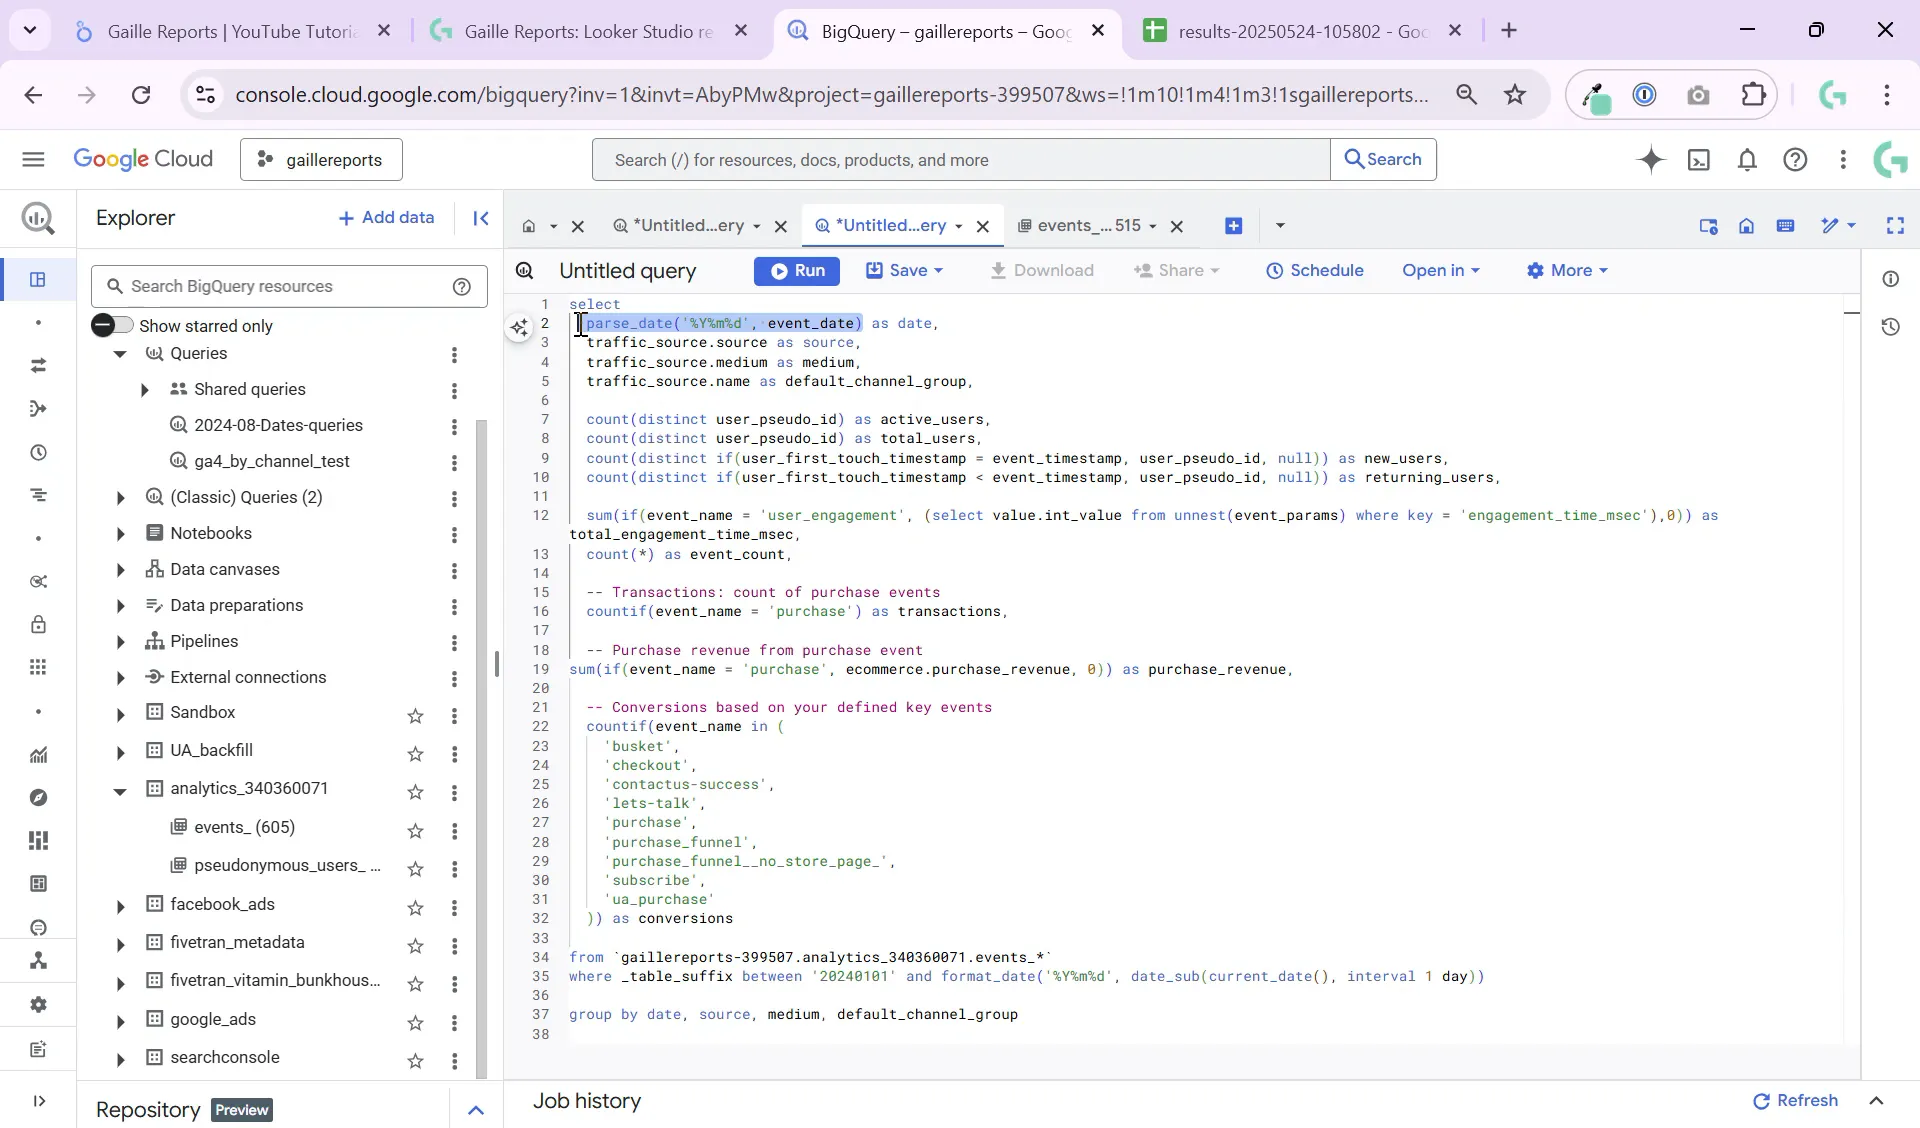
Using DATE_SUB(CURRENT_DATE(), INTERVAL 1 DAY) ensures your query always pulls data up to yesterday, perfect for scheduling daily updates.
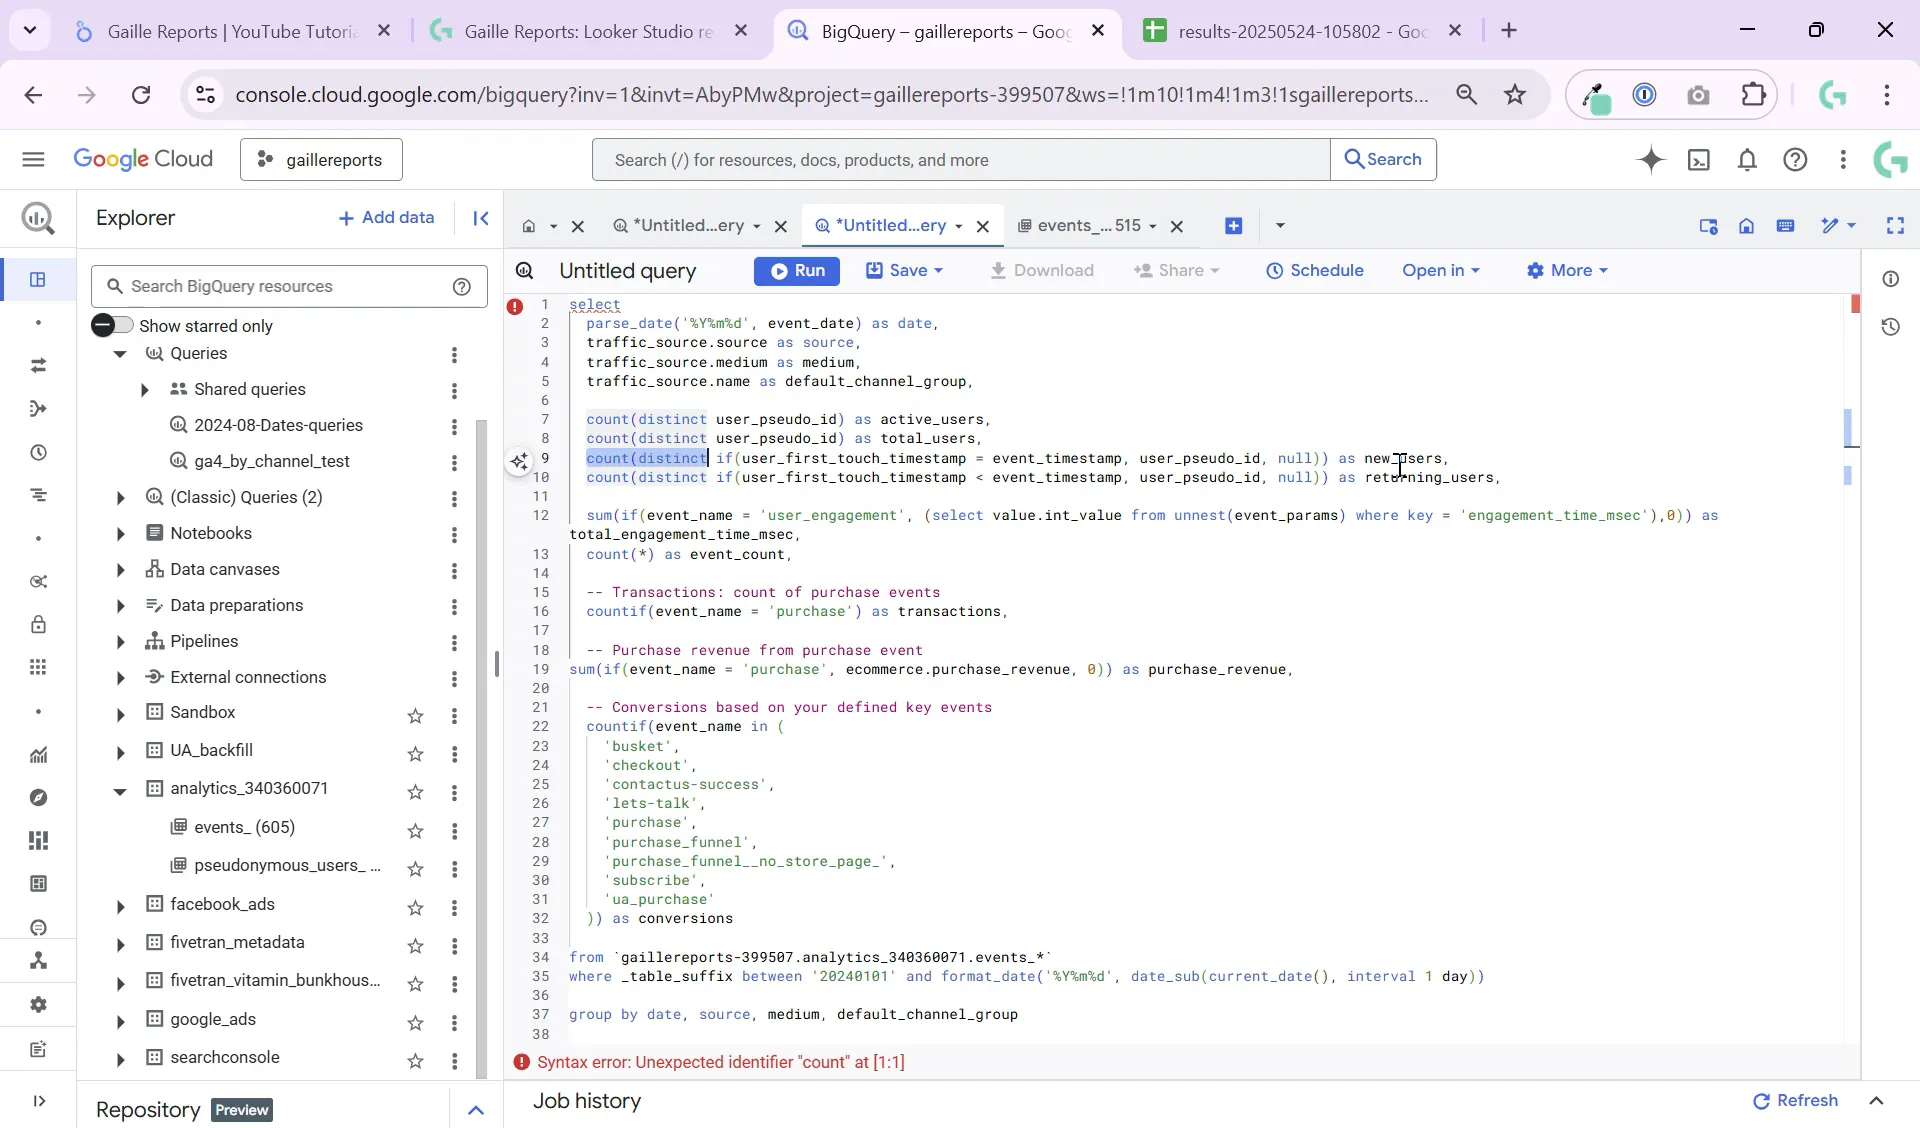
Step 4: Counting Active and New Users
To count active users, use:
COUNT(DISTINCT user_pseudo_id)
This counts unique users identified by GA4’s pseudo ID. Since most sites don’t have authenticated users, user_pseudo_id is a reliable way to track unique visitors.
To count new users, check if the user_first_touch_timestamp equals the event_timestamp. If they match, this event is the user’s first interaction, making them a new user:
COUNT(DISTINCT IF(user_first_touch_timestamp = event_timestamp, user_pseudo_id, NULL)) AS new_users
Step 5: Calculating Engagement Time
Engagement time is stored as a parameter named engagement_time_msec within the user_engagement events. To sum the total engagement time per day, unnest the event_params array and sum the integer values where the key matches:
SUM(IF(event_name = 'user_engagement', (SELECT value.int_value FROM UNNEST(event_params) WHERE key = 'engagement_time_msec'), 0)) AS total_engagement_time_msec
Since average engagement time per user is better calculated in your BI tool (like Looker Studio), it’s best to keep this as a total sum in BigQuery and do the division later.
Step 6: Counting Transactions and Purchase Revenue
If your site supports ecommerce, GA4 records purchase events with the event name purchase. To count transactions and sum revenue:
- Count purchases:
COUNTIF(event_name = 'purchase') AS transactions
- Sum purchase revenue:
SUM(IF(event_name = 'purchase', ecommerce.purchase_revenue, 0)) AS purchase_revenue
Make sure your ecommerce data is properly set up in GA4, especially if you use enhanced ecommerce or GTM custom tags. If you have custom purchase event names, adjust the query accordingly by checking all event names on your site.
Step 7: Counting Conversions
Conversions are other important events that signal your business goals, like form submissions or newsletter signups. To count conversions, first identify which event names count as conversions by running a query to list all distinct event names.
Then, count all events matching those names using a clause like:
COUNTIF(event_name IN ('conversion_event1', 'conversion_event2', 'conversion_event3')) AS conversions
This flexible approach lets you customize conversion tracking based on your website’s unique setup.
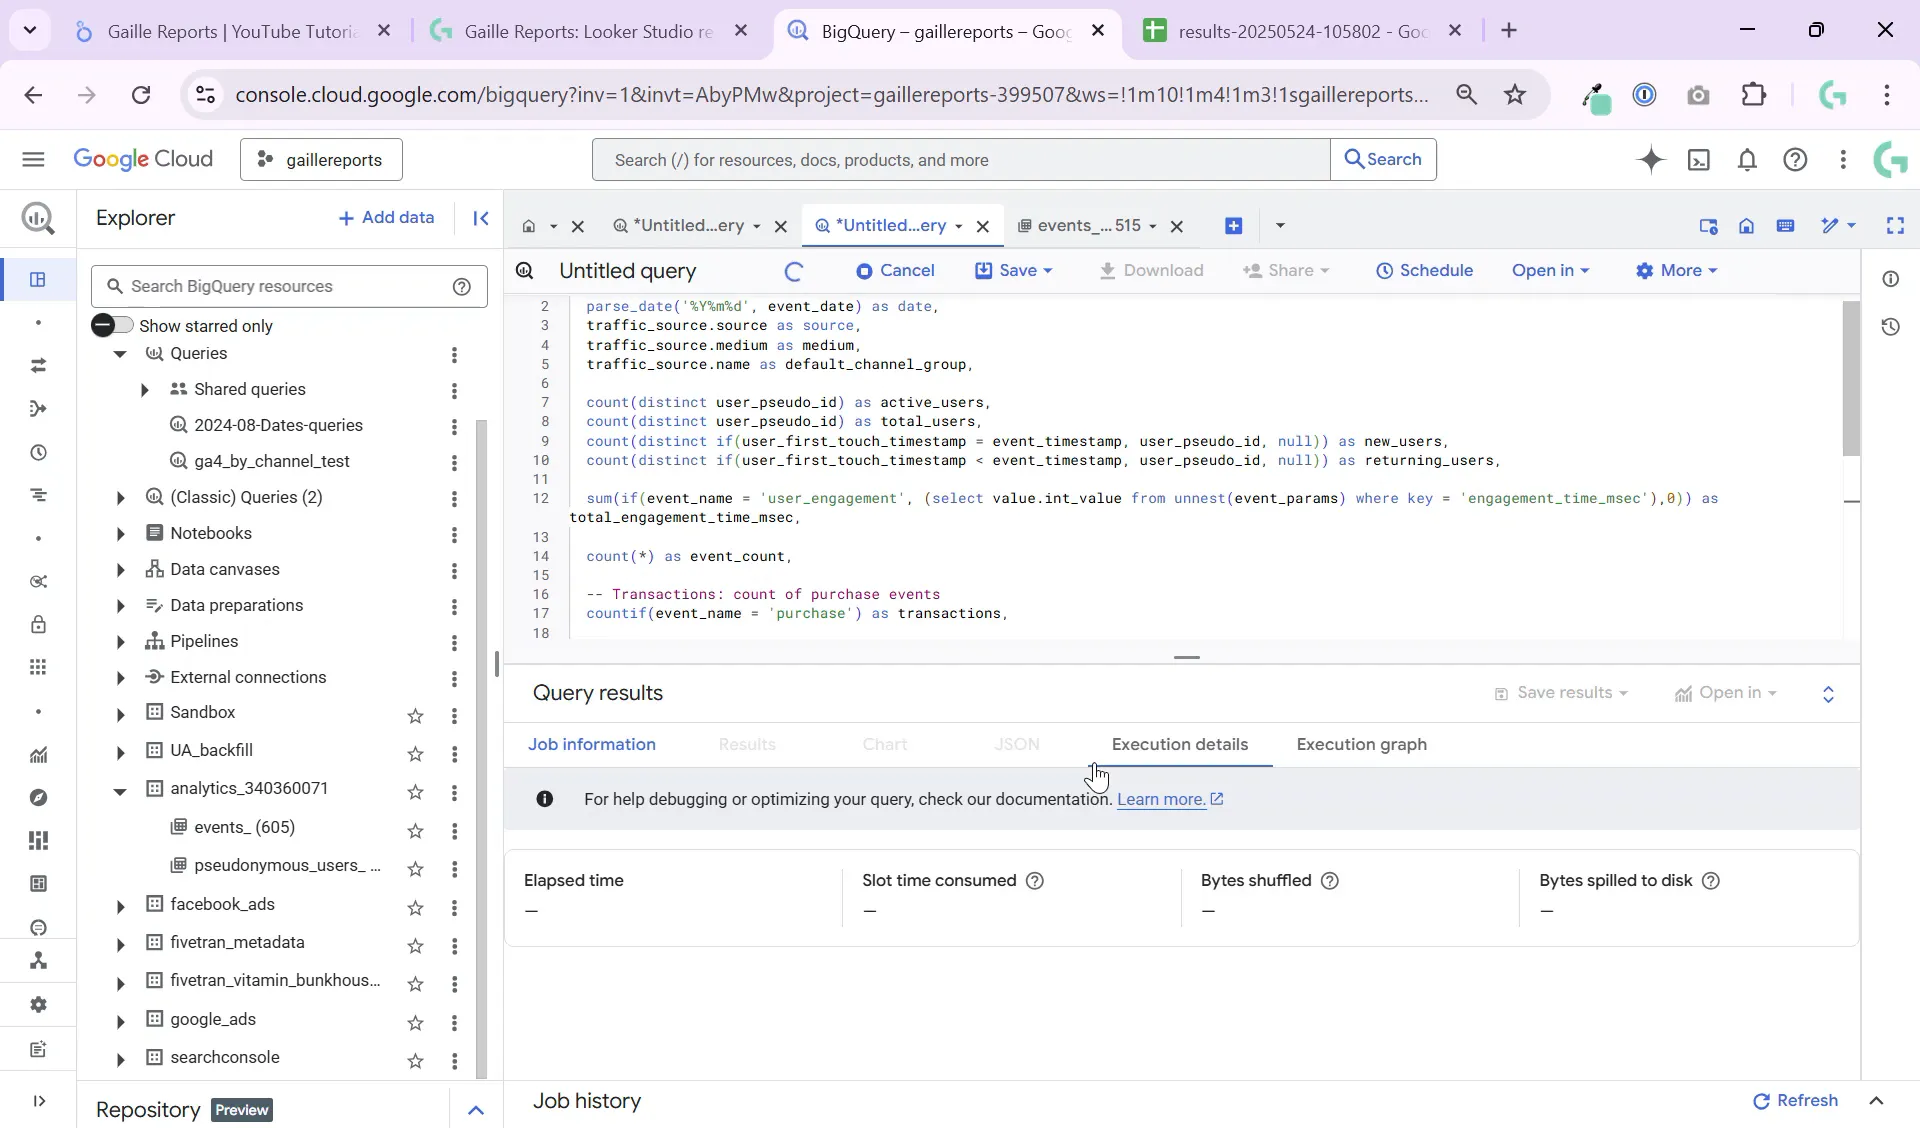
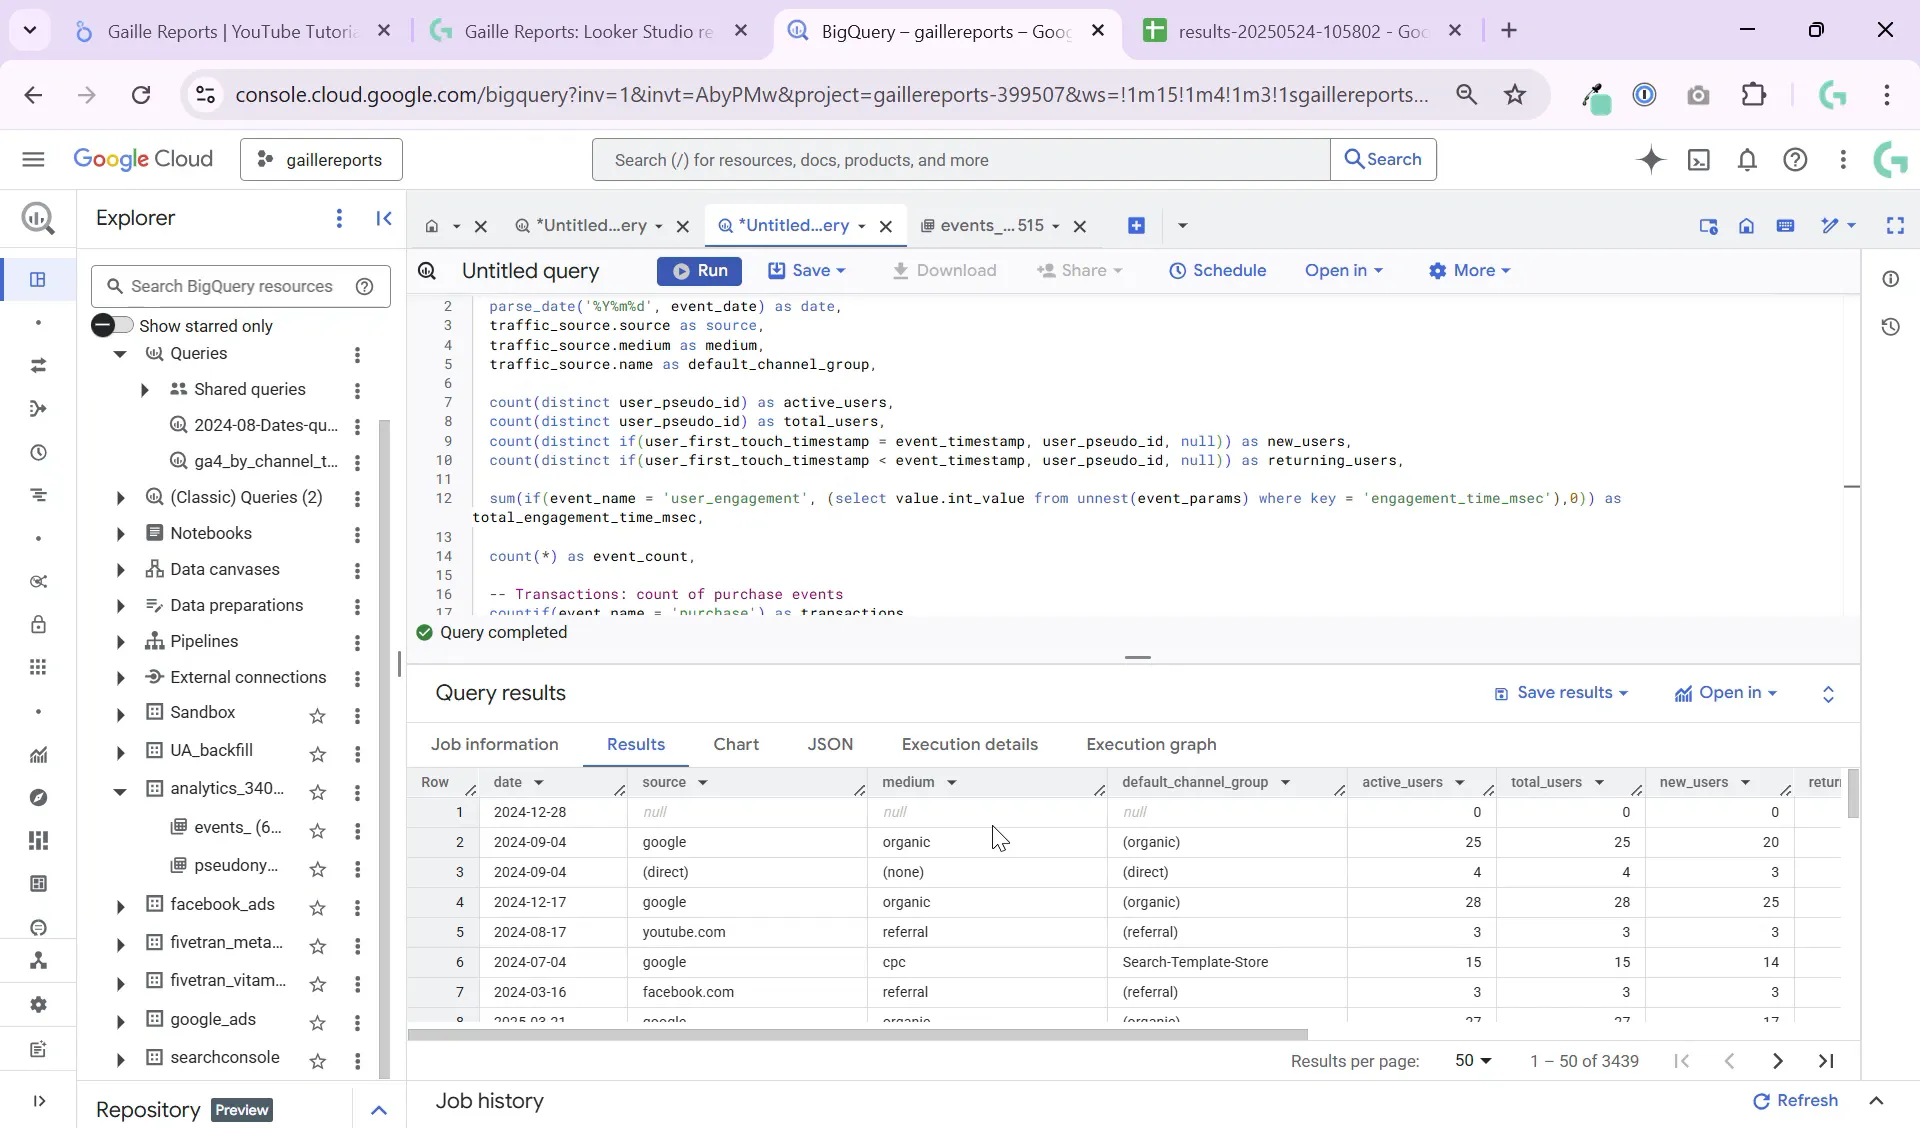
Step 8: Running the Query and Exporting the Table
Once your query is ready, run it in BigQuery. You’ll get a table similar to this:
- Dates as proper
DATEvalues - Source, medium, and default channel group columns
- Active users, new users, engagement time, transactions, purchase revenue, and conversions
You can export this table to Google Sheets or save it as a BigQuery table for further analysis and dashboarding in Looker Studio.
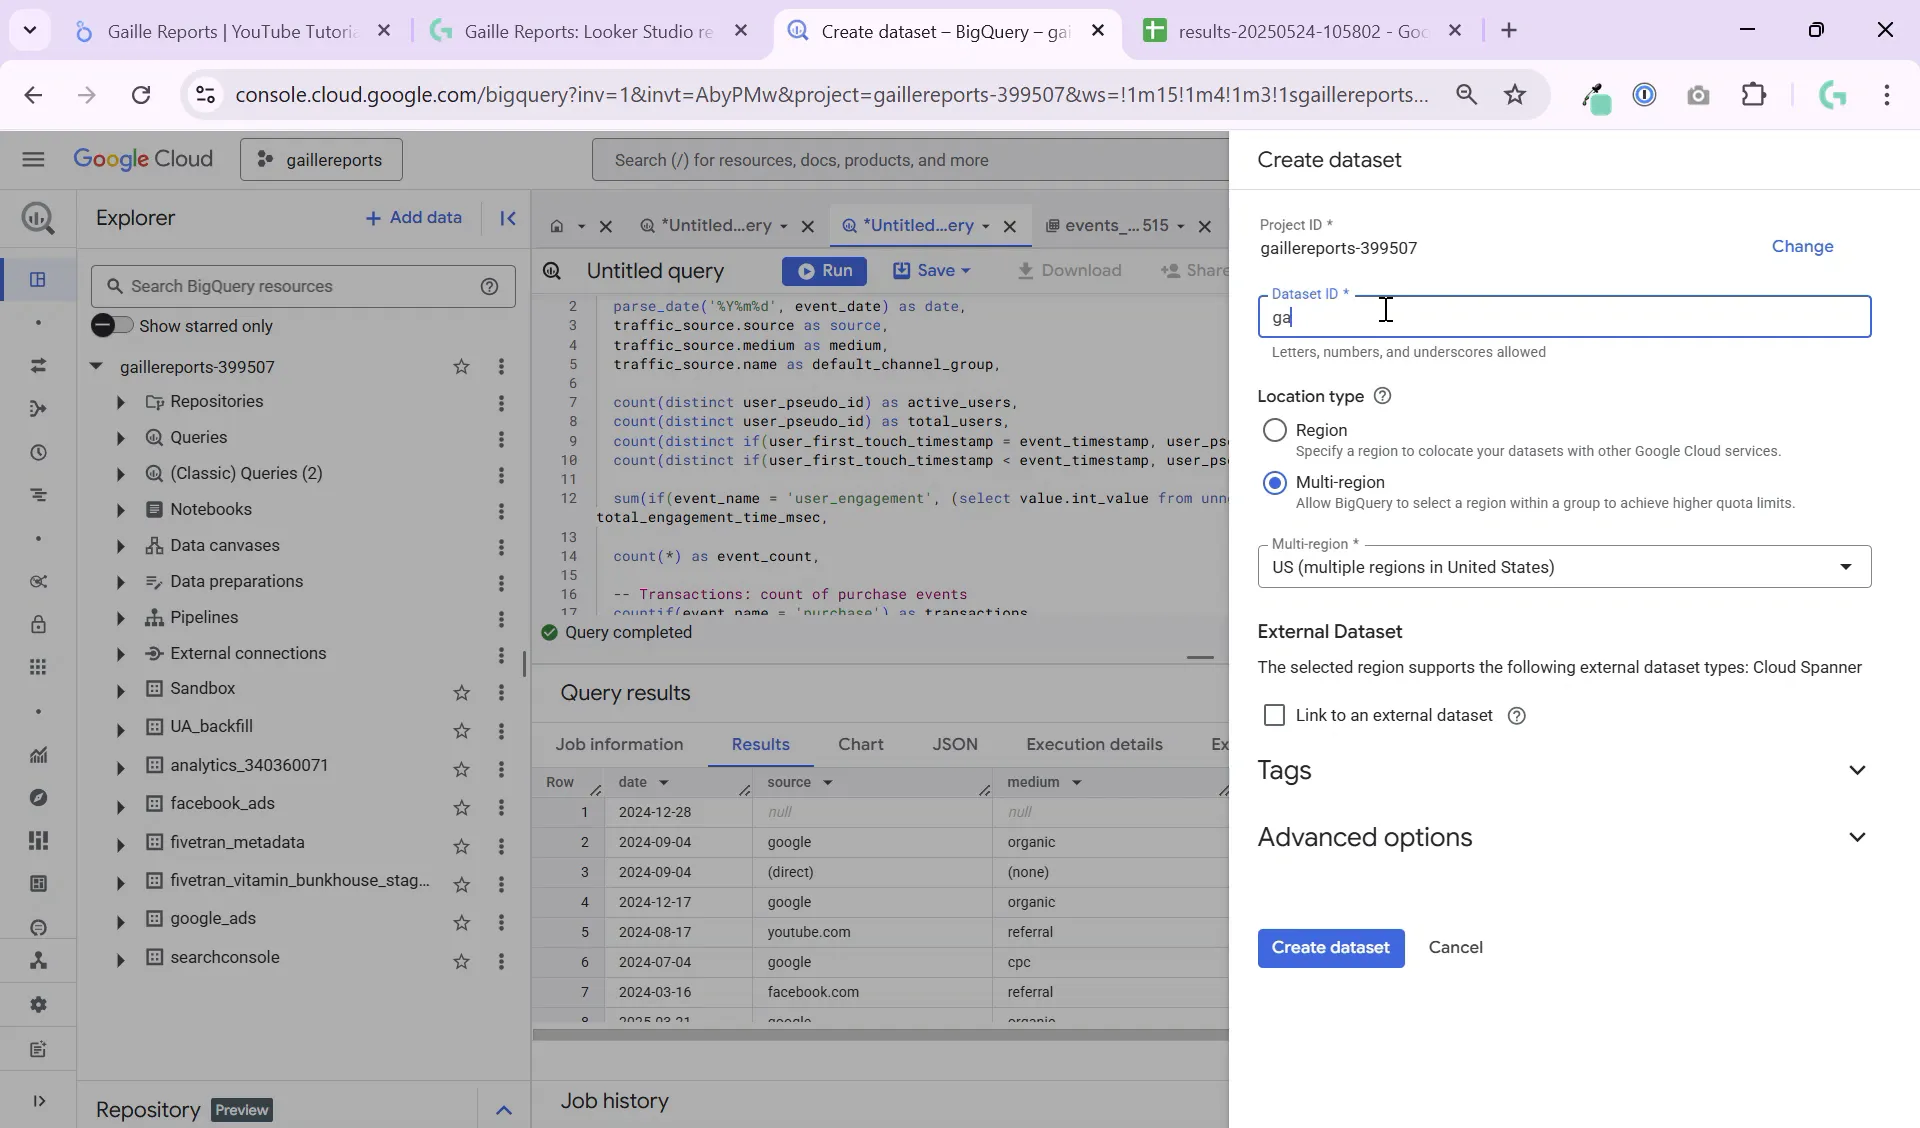
Step 9: Automating with Scheduled Queries
To keep your data fresh, set up scheduled queries in BigQuery. Create a new dataset (e.g., named ga4_reports) to store your processed tables.
Scheduling the query to run daily ensures your Looker Studio dashboard always shows up-to-date information without manual intervention.
Wrapping Up
This tutorial covered the essentials of querying GA4 data in BigQuery to build a daily active users table segmented by channel and source. You learned how to:
- Understand GA4’s partitioned event data
- Parse string dates and filter by table suffixes
- Count active and new users using user pseudo IDs and timestamps
- Sum engagement time, transactions, and purchase revenue
- Count conversions based on custom event names
- Export and automate your queries for daily updates
This process helps you create a simplified yet powerful data structure ready for Looker Studio dashboards, enabling better marketing insights and decision making.
For more detailed tutorials on GA4 and BigQuery, check out these helpful articles:
- How to Query GA4 Top Pages in BigQuery by Event: A Step-by-Step Tutorial
- BigQuery GA4 Tutorial: Distinguish New and Returning Users Easily
- How to Filter GA4 Users by Device in BigQuery: Step-by-Step
If you have questions or want to learn more about Looker Studio, Google Sheets, or BigQuery, feel free to reach out. Happy analyzing!