
From Data to Insight: How to Use Looker Studio’s Conversational AI
Are you curious about how conversational analytics can transform your data analysis workflow in Looker Studio? In this article, I’ll walk you through my personal experiment using Looker Studio Pro’s conversational analytics feature powered by Gemini AI. If you want a detailed and practical demonstration, feel free to watch the full video tutorial here: Watch the tutorial on YouTube.
Step 1: Setting Up Your Data for Conversational Analytics
Conversational analytics in Looker Studio Pro allows you to interact directly with your data using natural language, making it easier to generate insights without writing complex SQL queries. Before diving into the AI interaction, the most crucial step is preparing and connecting your dataset appropriately.
In my case, I prepared a dataset containing daily website traffic metrics such as source, medium, channel group, user engagement metrics, and transactions. This dataset was structured by day and stored in Google Sheets, but for this experiment, I connected it to BigQuery for more robust querying capabilities.
When connecting data sources to Looker Studio Pro, remember that Looker Studio and Looker are different platforms. Here, I used Looker Studio Pro’s connection to BigQuery, which supports tables, Google Sheets, or CSV uploads.

Step 2: Introducing Conversational Analytics AI and Initial Questions
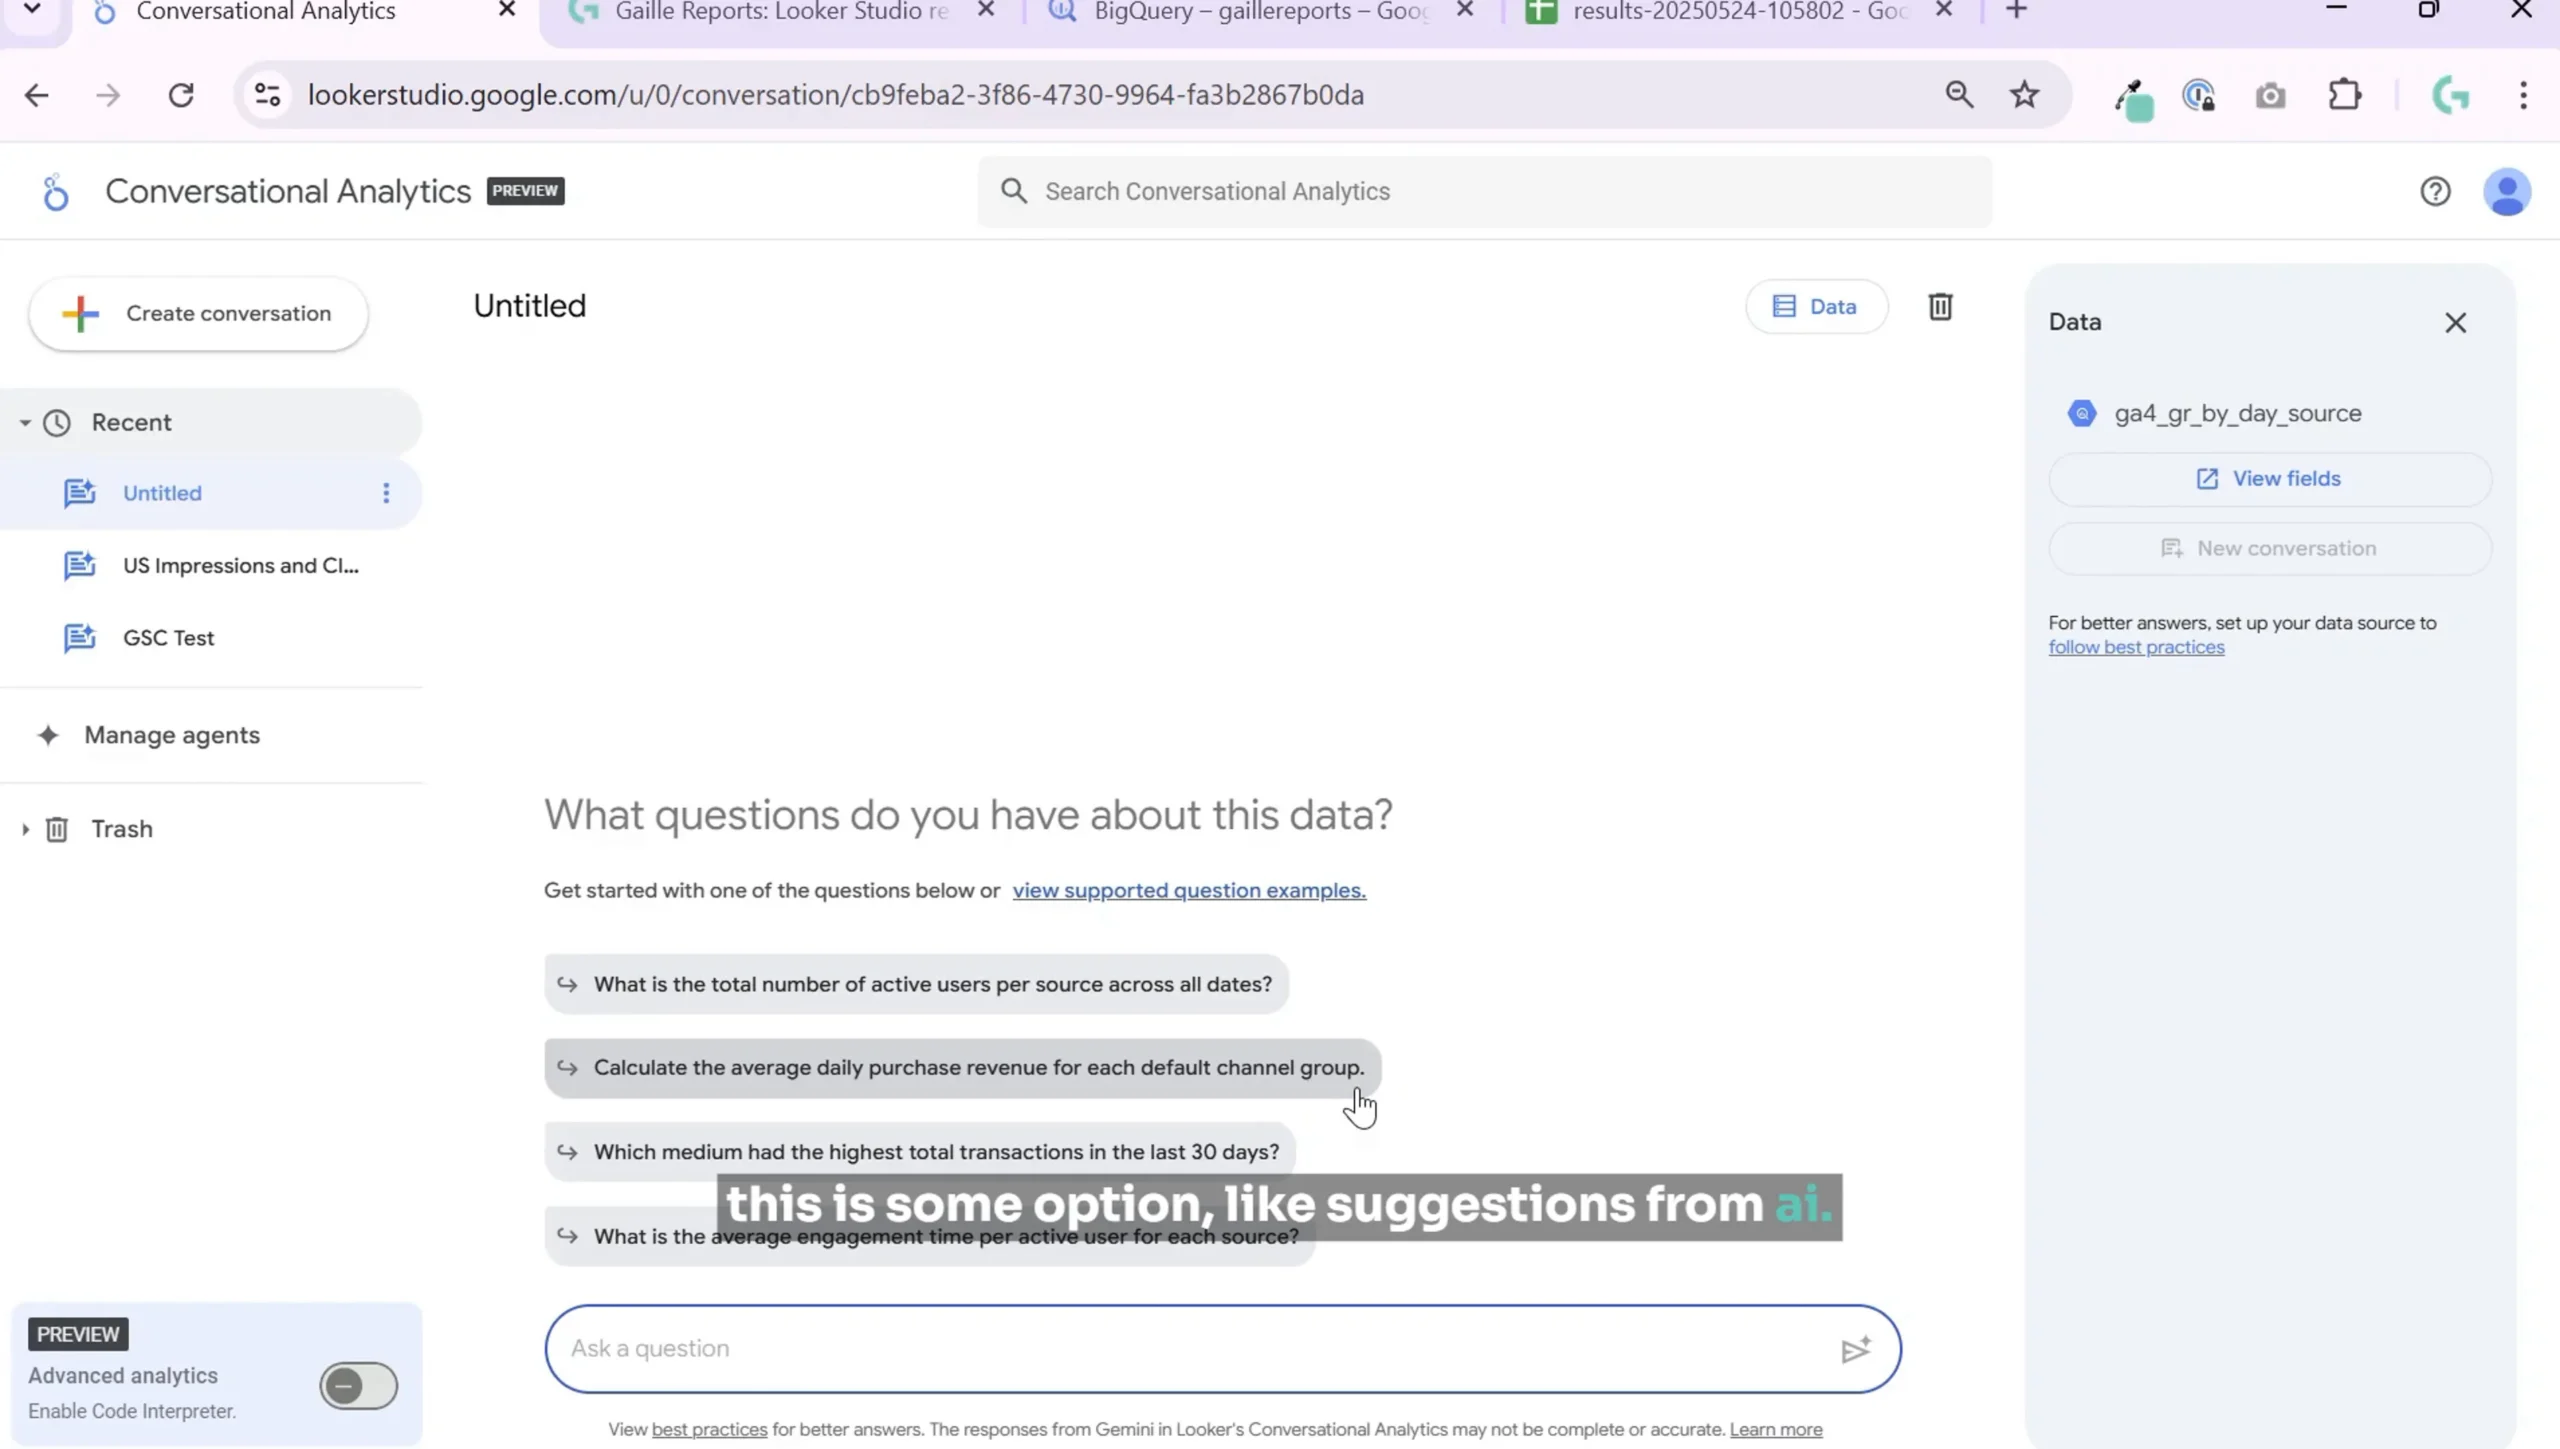
Once the dataset was connected, I started exploring the AI assistant’s capabilities by posing some initial questions about my data. The AI suggested some interesting queries such as:
- Total number of active users per source across all data
- Daily purchase revenue for each default channel group
- Which medium has the highest total transactions in the last 30 days with average engagement time
These suggestions gave me a quick glimpse of what I could ask and how the AI interprets the dataset.
Step 3: Understanding the Dataset Through AI
To get started, I asked the AI to explain the dataset. The AI provided a clear answer, describing the table as containing daily website traffic data with fields such as date, source, medium, channel group, number of users, new and returning users, engagement time, and transactions.
This step is vital because it ensures that both you and the AI are on the same page regarding the data structure, which is essential for accurate query results.

Step 4: Querying Active Users by Channel Group Over Time
My first real question was about active users from different channel groups and how their proportions change over time. The AI generated a query and returned a table showing active users by default channel group and date. It also created a chart plotting these active users over time.
While I appreciated the convenience of having the AI automatically generate charts, I found the time series chart a bit difficult to read, especially since it showed daily data with many data points.
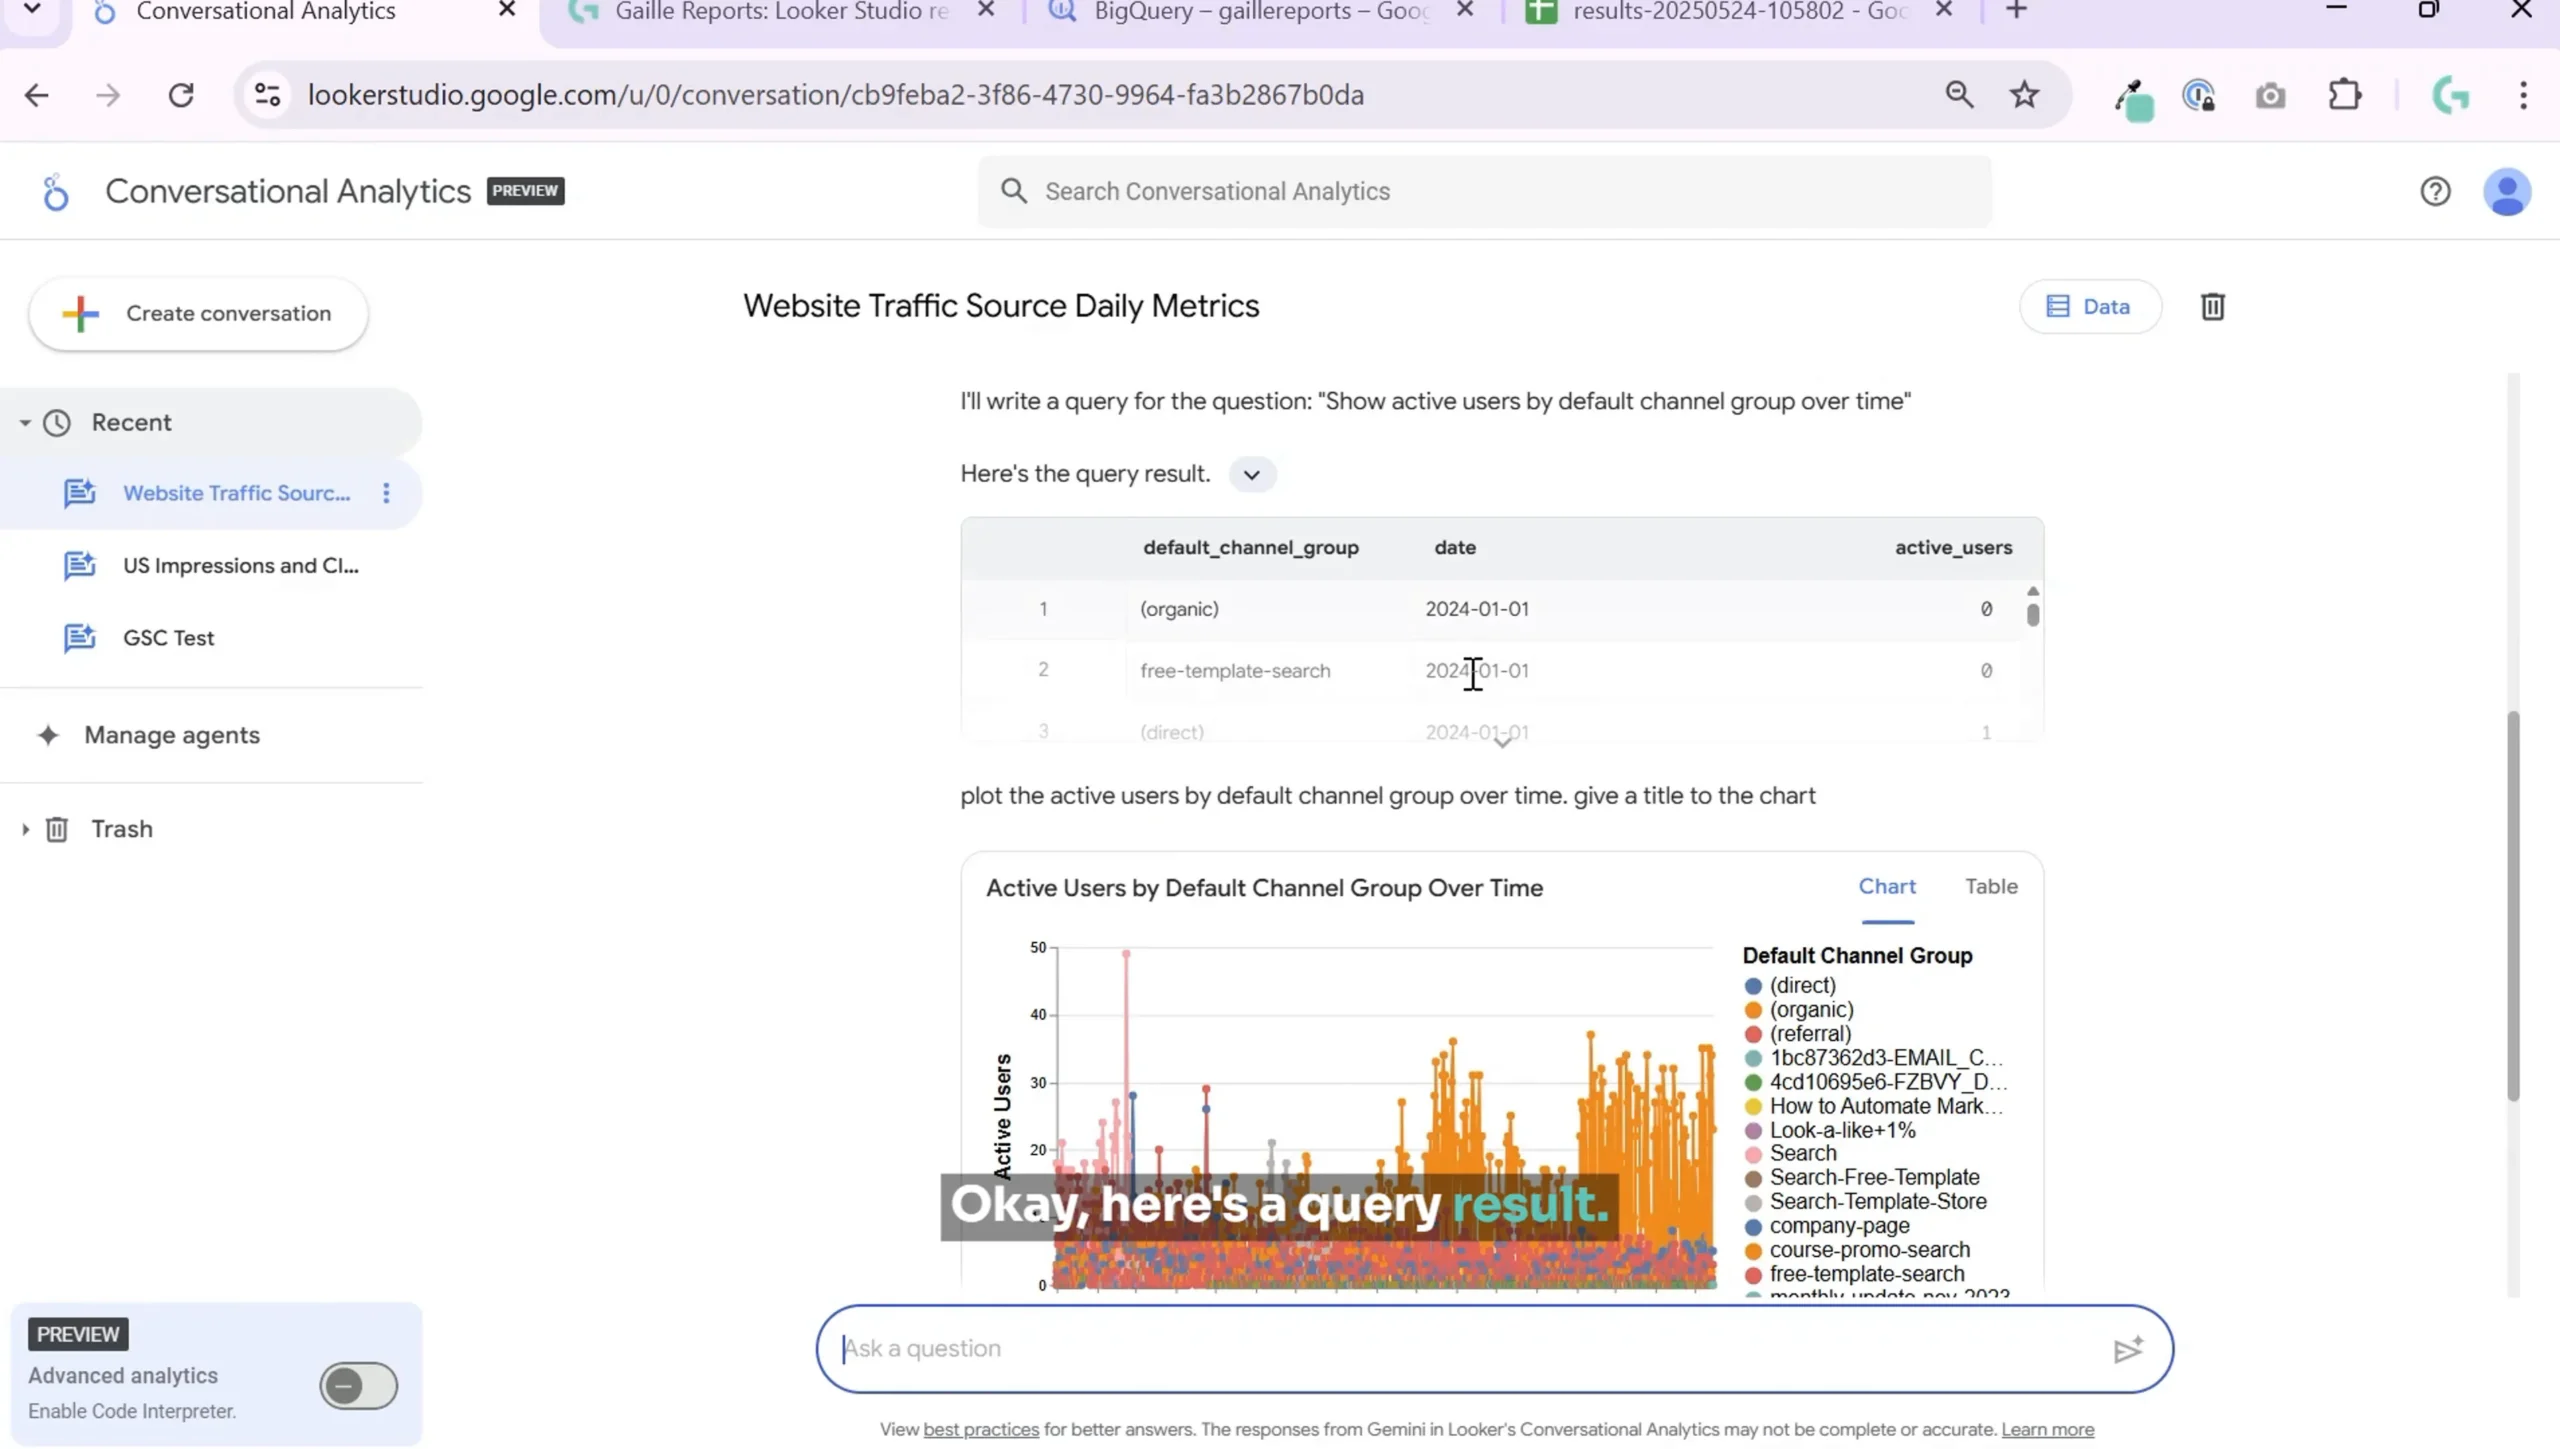
The chart revealed that organic traffic dominated, with some periods showing paid search activity. However, the chart’s readability could be improved by aggregating data on a monthly basis or using different chart types.
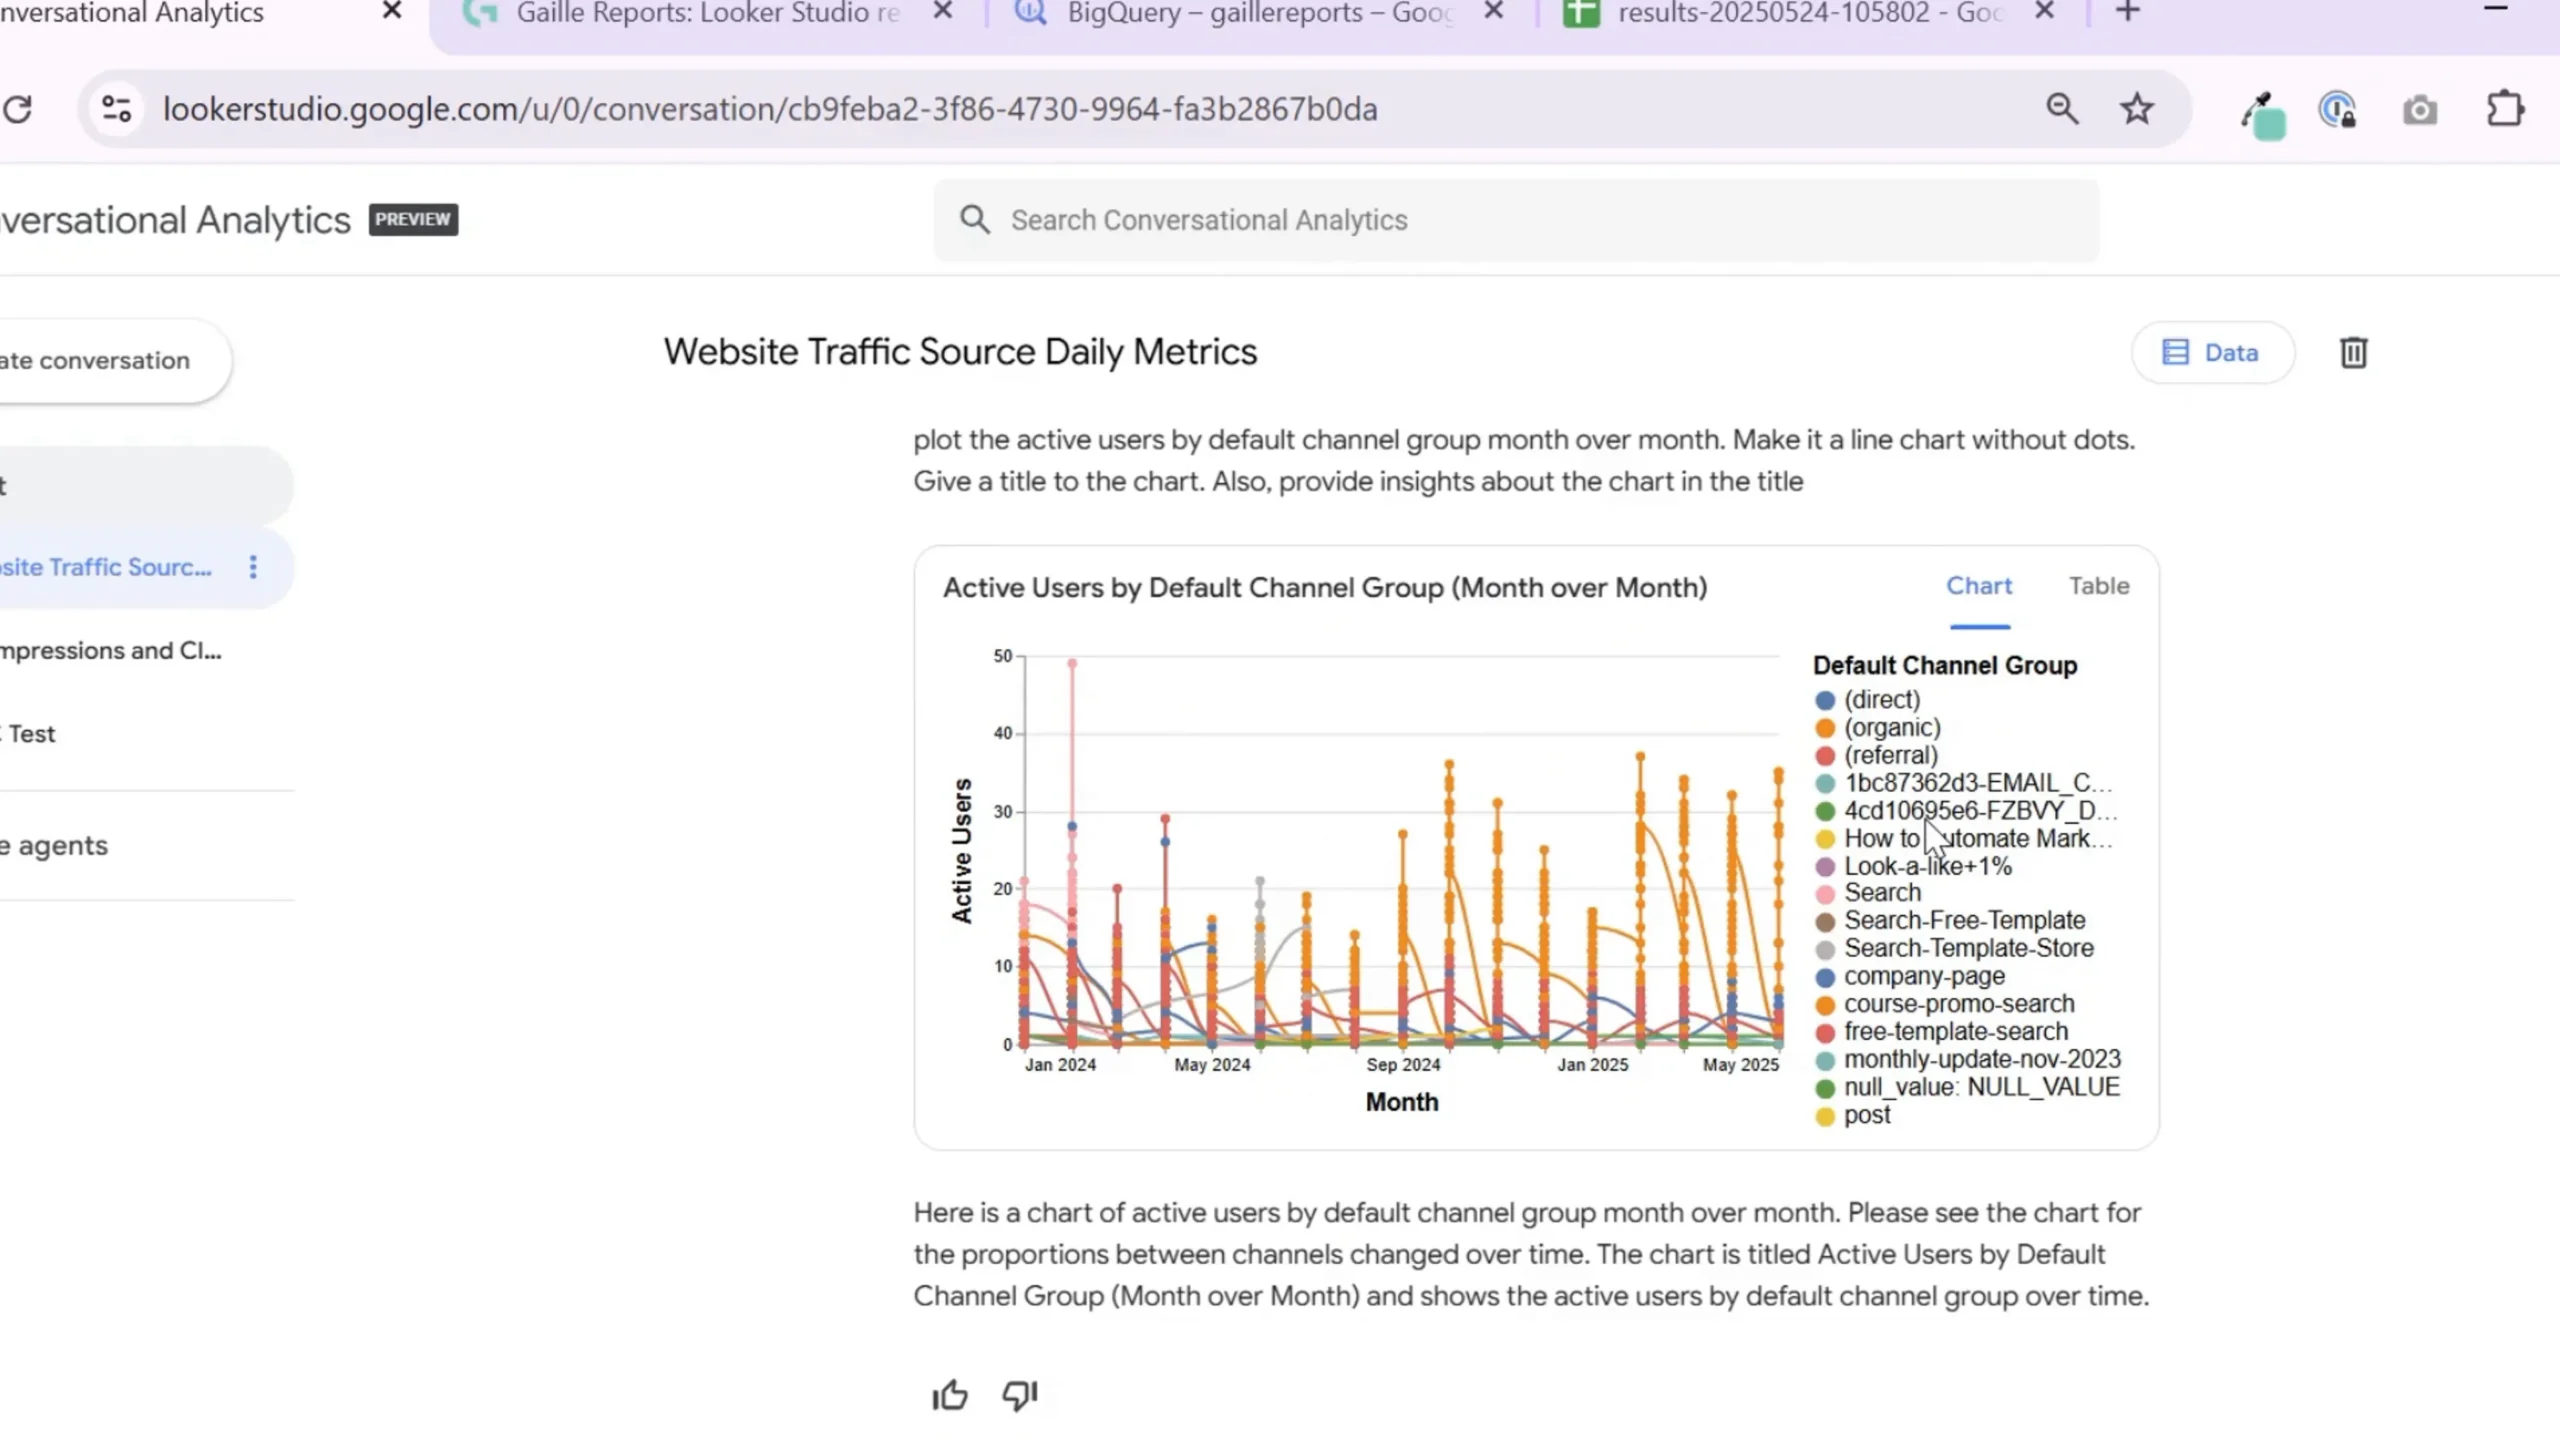
Step 5: Refining the Chart for Better Readability
I asked the AI to group the data month-over-month and present it without dots to improve readability. The AI generated the requested chart, but I still found the visualization challenging to interpret.
Although the AI offered several ways to analyze the data, including comparing active users across channels and examining trends for new and returning users, I wanted more insightful commentary on the data trends.
Step 6: Requesting Insights from the AI
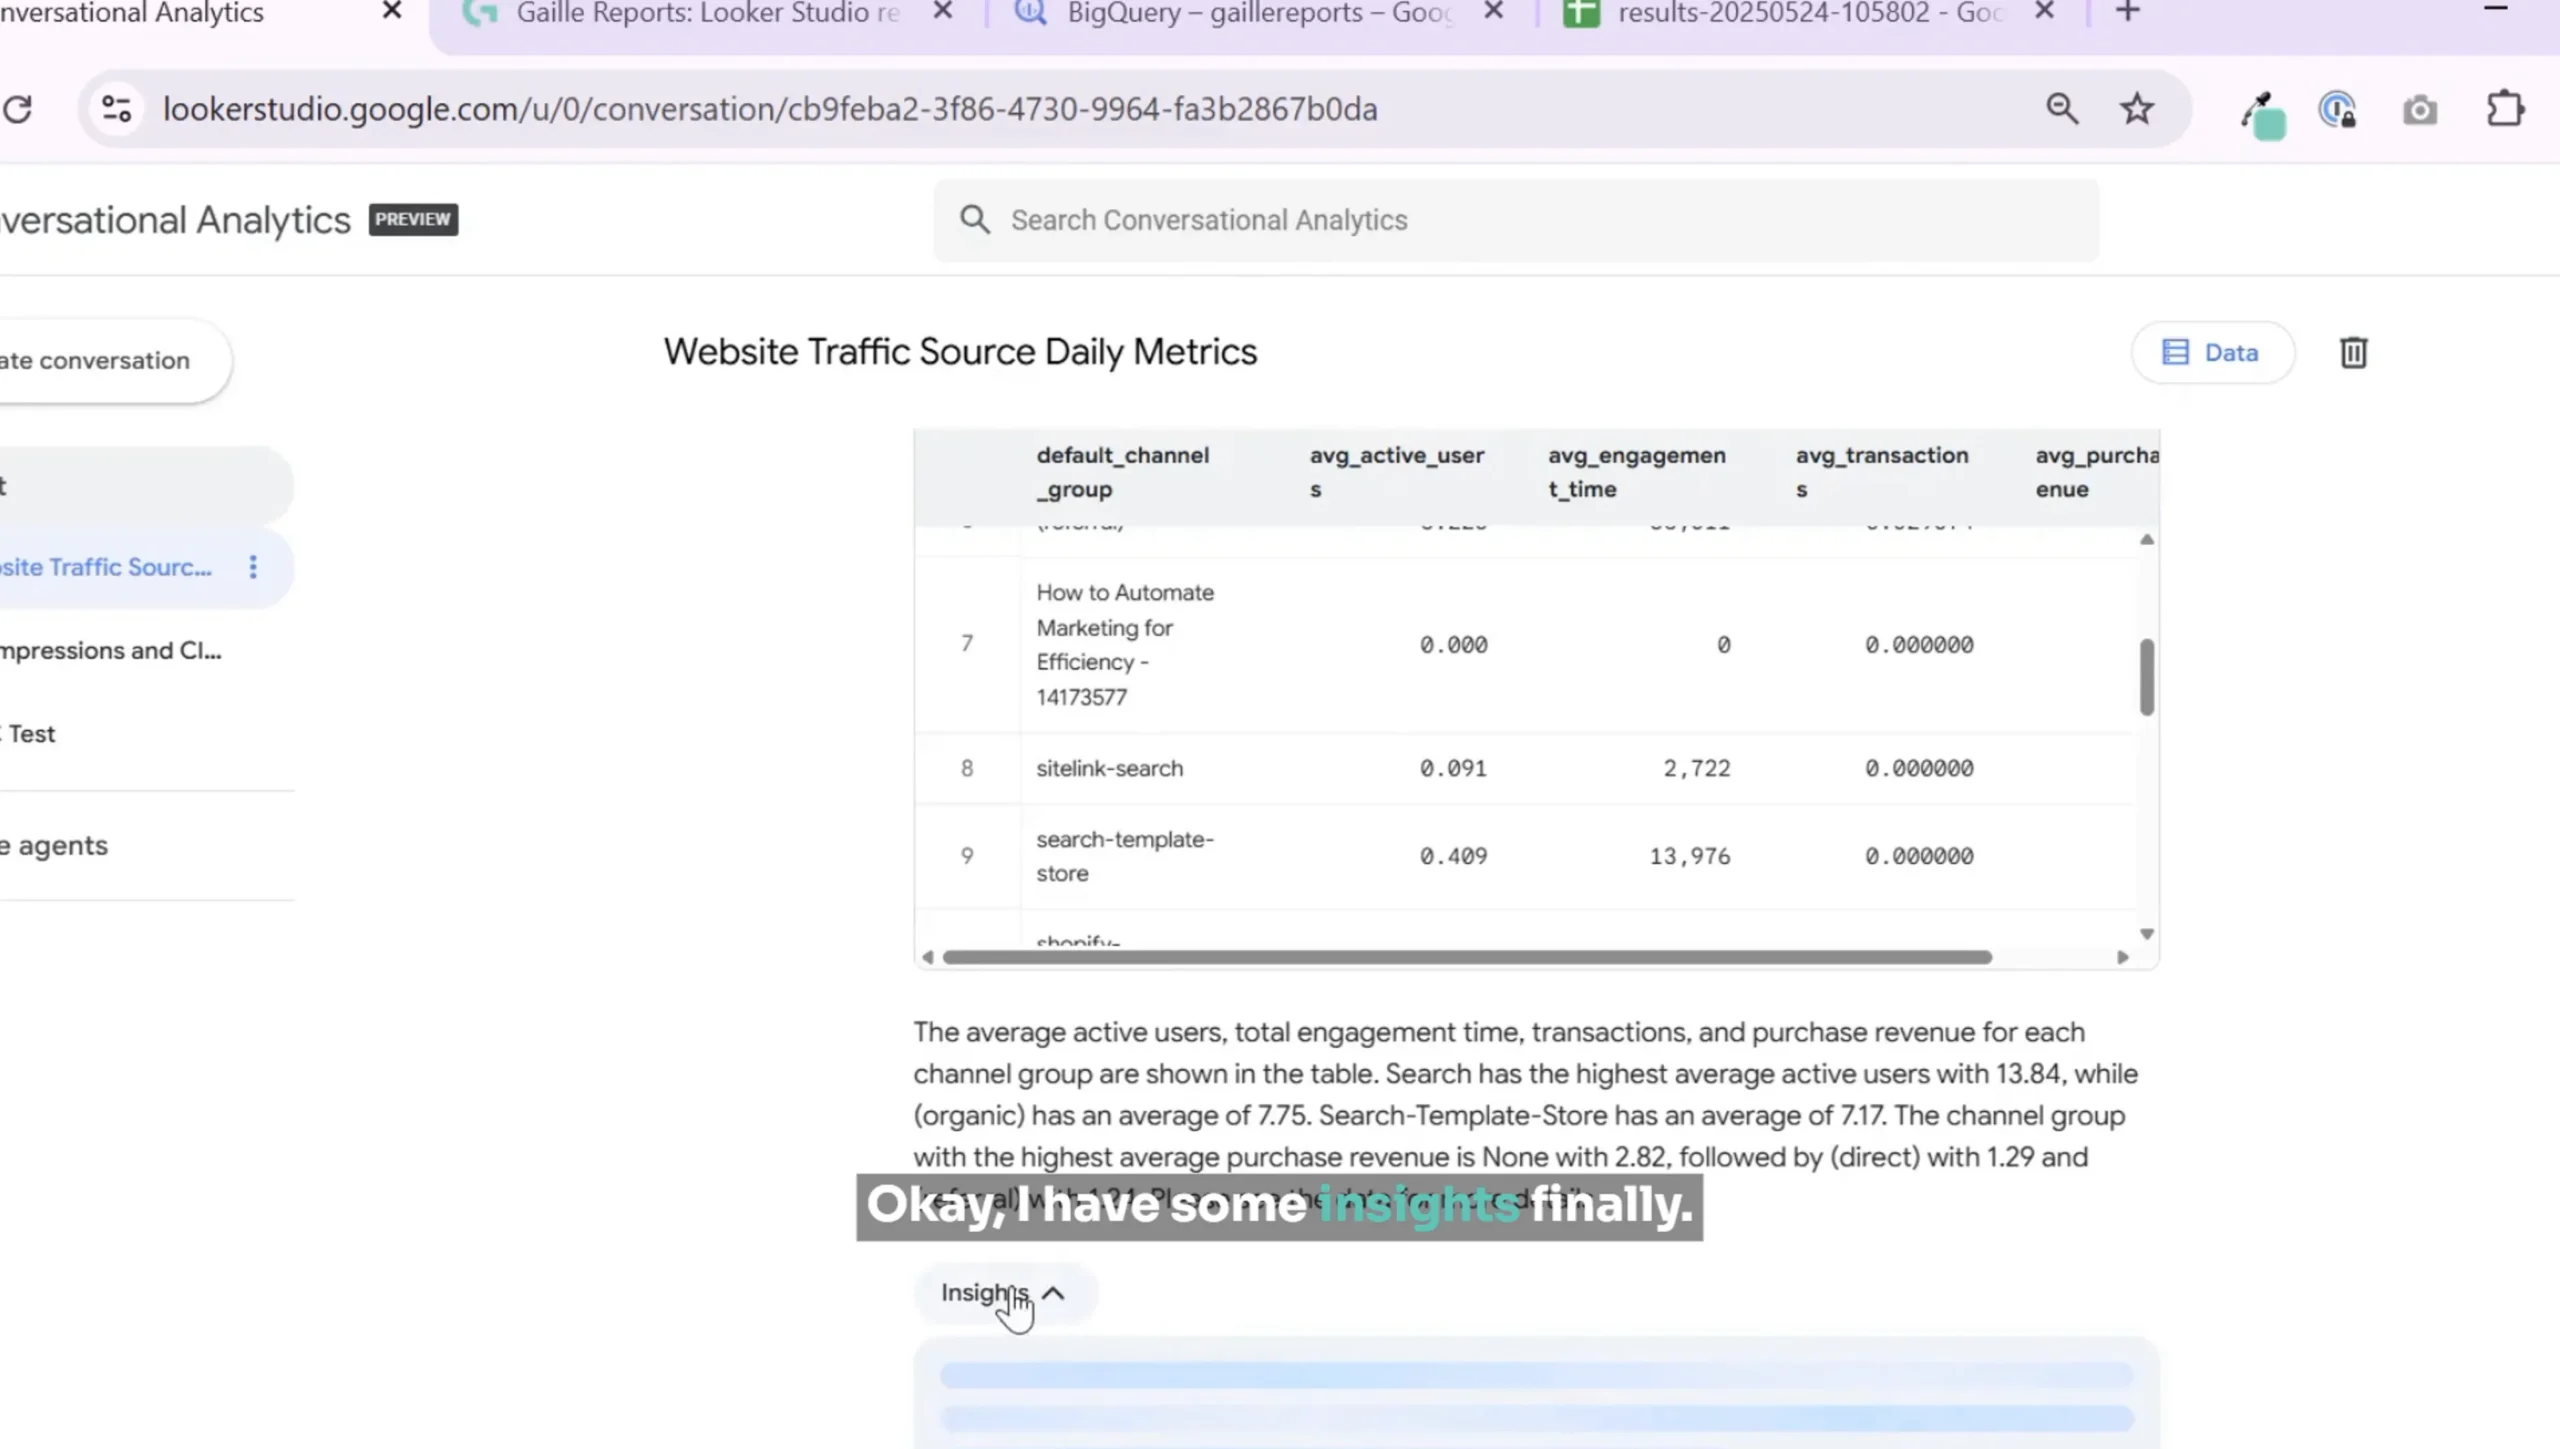
At one point, I requested insights from the AI about the data. It finally provided some basic insights, such as:
- Search channel had the highest average active users (13.45)
- Organic channel averaged 7.75 active users
- Direct referral channel showed the highest average purchase revenue
While these insights were helpful, I felt the AI could have offered more detailed commentary and actionable observations based on the dataset.
Step 7: Troubleshooting and Asking Clearer Questions
Conversational analytics is still evolving, and I encountered some hiccups. For example, when I asked about the growth of organic search active users over time, the AI initially failed to find matching data due to ambiguous phrasing.
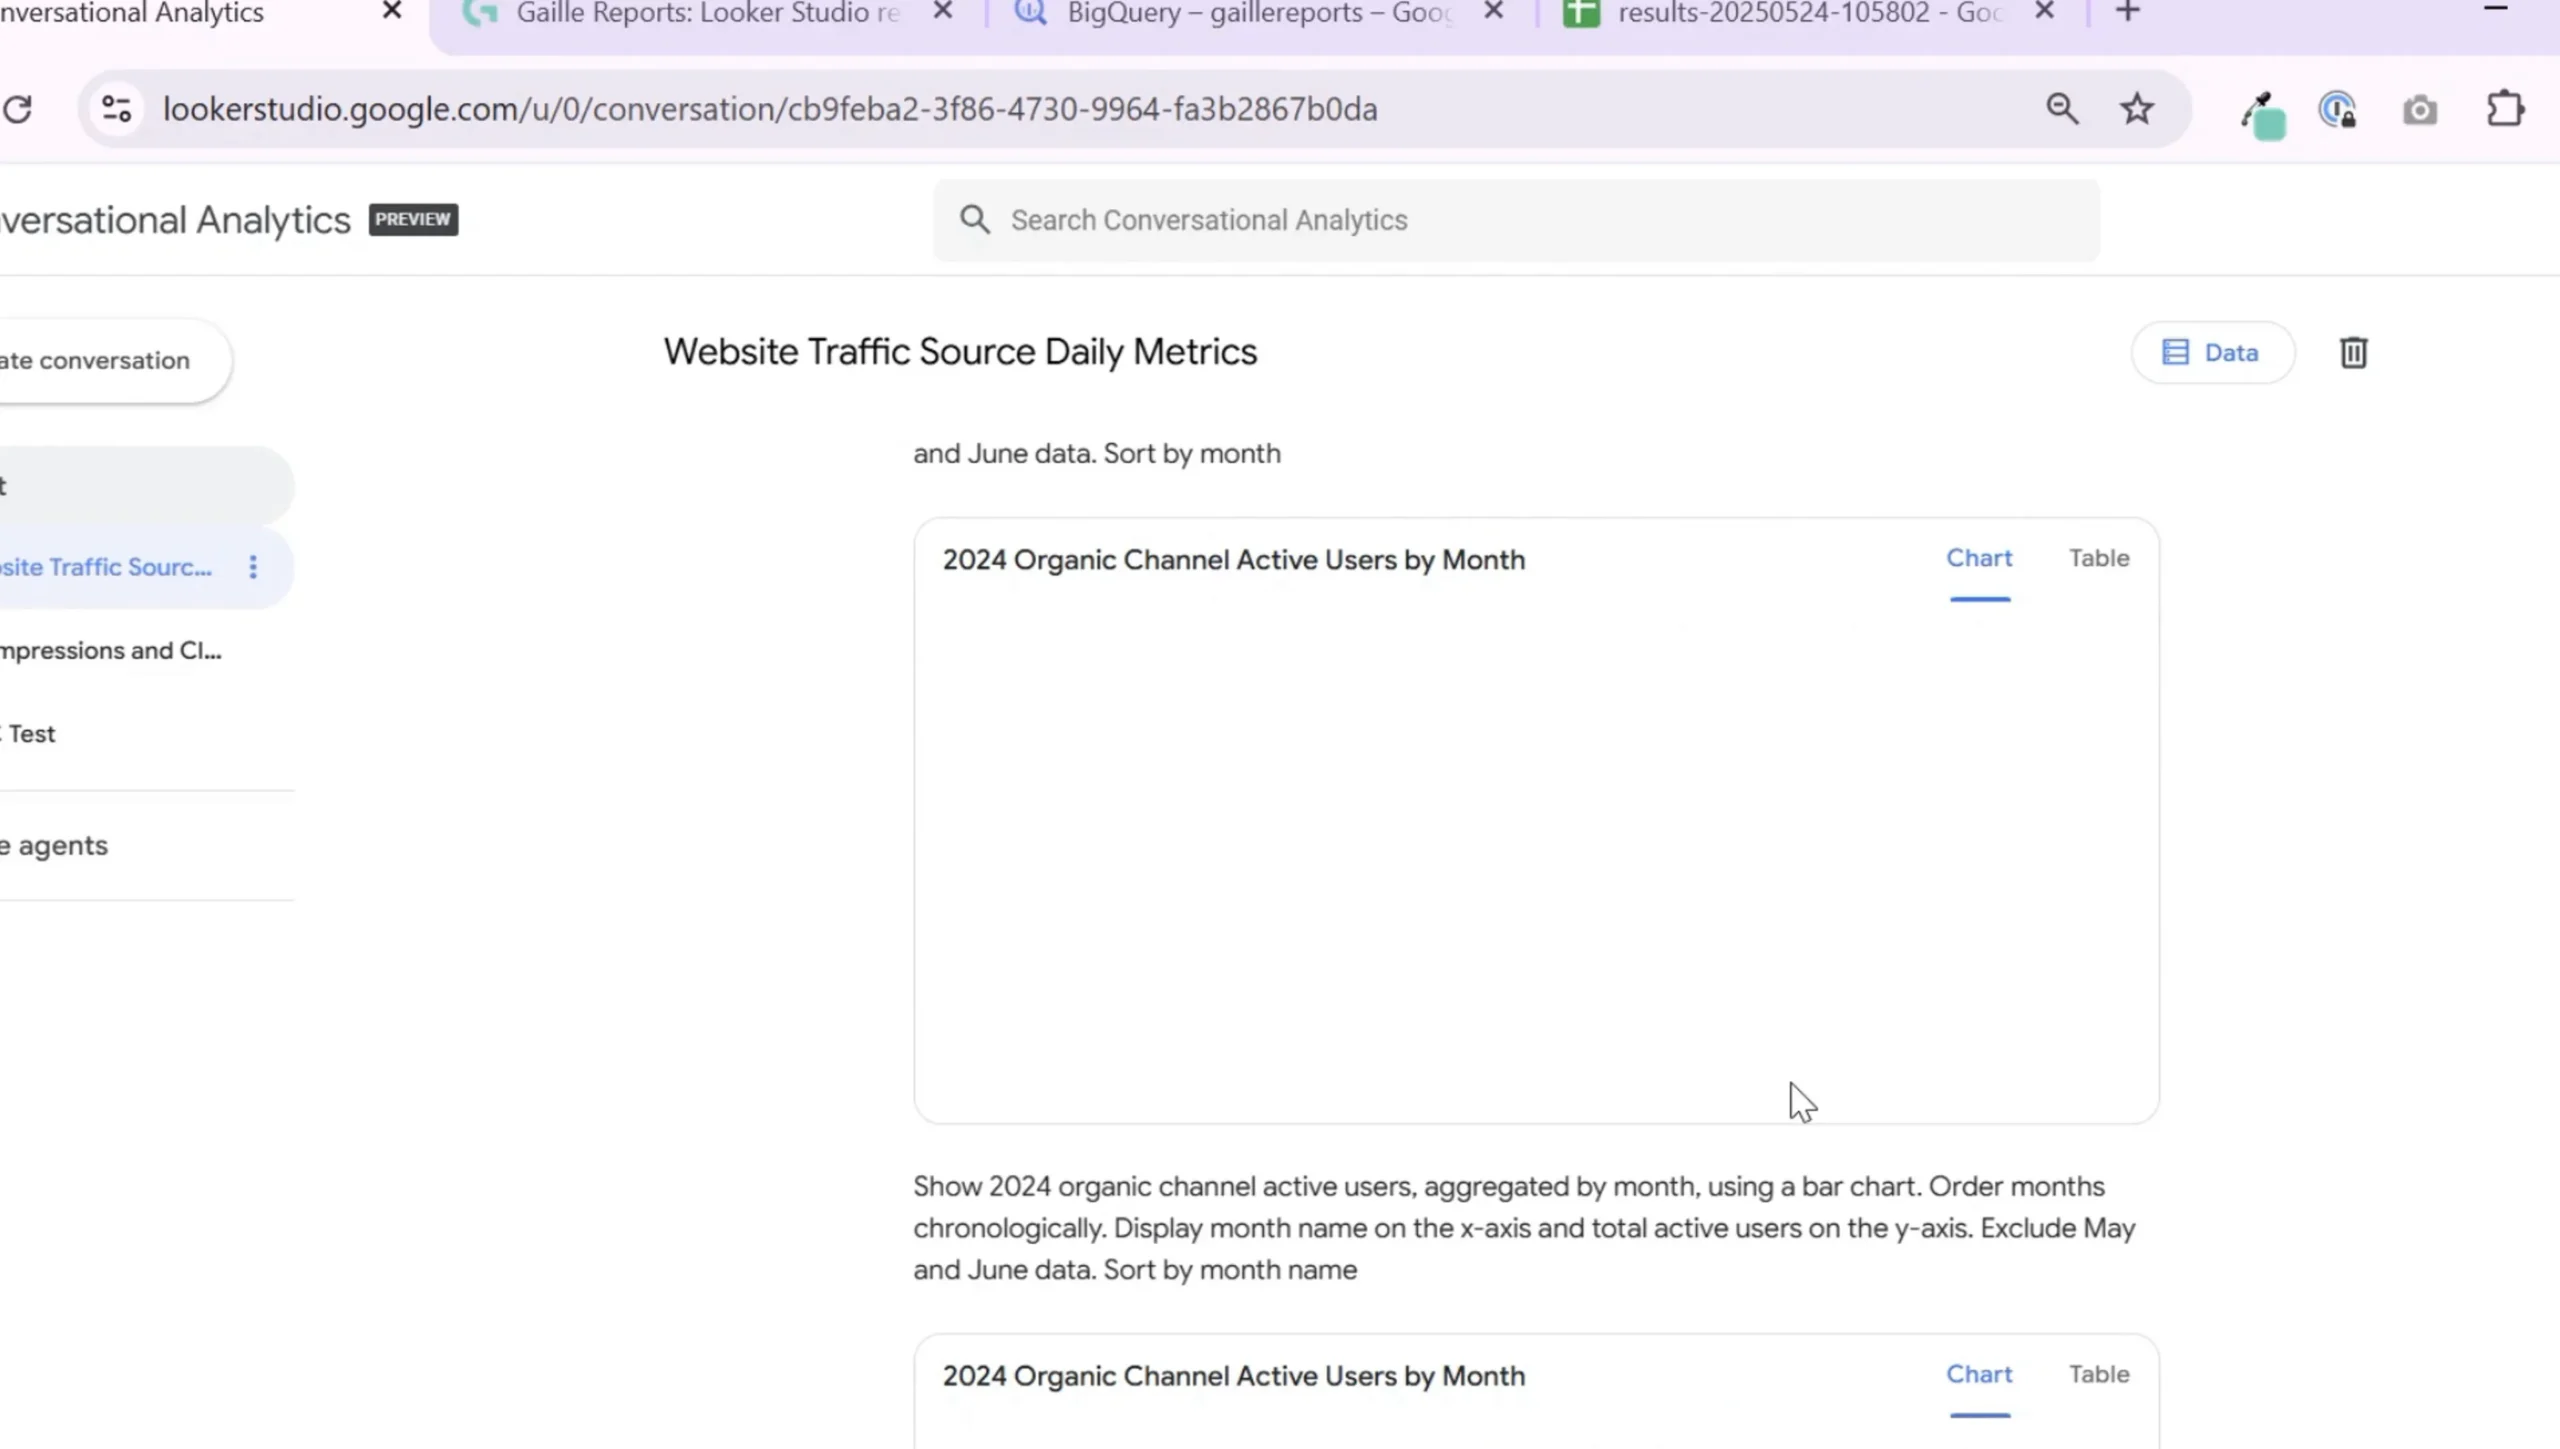
By refining my question and simplifying it, I was able to get a successful query and a chart showing organic search active users growing month over month.

Still, I struggled to customize the chart style, such as changing from a line graph to bar chart or adjusting the date grouping, which felt a bit clunky for now.
Step 8: Final Thoughts on Using Conversational Analytics in Looker Studio
Overall, conversational analytics in Looker Studio Pro shows great promise. It can quickly generate SQL queries, visualize data, and provide basic insights without requiring users to write code or master the Looker Studio interface.
However, the tool currently has some limitations:
- Chart readability can be an issue with daily data and complex queries
- Insight generation is somewhat basic and could be more detailed
- Customization of charts via natural language commands is limited
- It requires clear and precise questions to avoid errors or incomplete data
For now, I see conversational analytics as a useful exploratory tool to find trends and generate ideas quickly. It can speed up dashboard design by providing initial charts and queries that you can refine manually afterward.
In the future, I expect this feature to become more powerful and user-friendly as AI models improve and integrate deeper with Looker Studio’s visualization options.
Wrapping Up
Conversational analytics in Looker Studio Pro is an exciting step toward making data analysis accessible for marketers, content creators, and business users. While it’s not yet a complete replacement for manual dashboard creation, it can help you explore your data faster and with less technical friction.
If you’re interested in more practical tutorials and in-depth reviews related to Looker Studio and BigQuery, check out these articles:
- What’s New in the Looker Studio Update
- Looker Studio Pro: Is It Worth It? Honest Review & Features You Should Know
- How to Connect BigQuery to Looker Studio: Beginner Friendly Tutorial
Feel free to experiment with conversational analytics yourself and share your experiences or use cases. The technology is evolving, and your feedback can help shape the future of data analysis in Looker Studio.
Happy analyzing!