
How to Query GA4 Data in BigQuery Using _TABLE_SUFFIX (Full Tutorial)

If you’ve recently set up your GA4 export to BigQuery, you’re probably eager to start querying your data efficiently. In this guide, I’ll walk you through how to create your first query using the _TABLE_SUFFIX pseudo-column, a powerful method to filter GA4 data by specific date ranges across multiple daily tables without writing overly complex SQL. This approach not only enhances query performance but also helps you save costs by scanning only the tables you need.
Before diving into the tutorial, feel free to check out my video tutorial that covers this topic step-by-step:
Step 1: Understanding GA4 Data Structure in BigQuery
Once you’ve set up the GA4 export to BigQuery, you’ll notice a new dataset folder inside your BigQuery project. For example, in my test project, I have a folder named my_g4. Inside this folder, you’ll see two subfolders: events and pseudo_anonymous_users.

The events folder contains what are called sharded tables. Unlike normal tables which have a single icon in BigQuery, sharded tables have a slightly different icon and are split by date. Each table includes a suffix with the year, month, and day, for example, events_20230512 represents the table for May 12th.

This daily partitioning is intentional. Instead of having one huge table, GA4 creates one table per day. This design has two big advantages:
- Efficiency: Querying a single day’s data is much faster than scanning a massive table with years of data.
- Cost savings: BigQuery charges you based on the amount of data scanned. By querying only the tables you need, you pay less.
For smaller websites, querying all data at once may not be a problem, but if your website has high traffic, querying all tables will slow down your work and increase costs unnecessarily.
Step 2: Why Avoid Querying All Tables at Once
Although you can query all daily tables by using a wildcard asterisk (*) in your table name, like this:
SELECT * FROM `your_project.your_dataset.events_*`
This approach is not recommended for the reasons mentioned above — it’s inefficient and costly. Instead, you want to filter your query to a specific date range using the _TABLE_SUFFIX pseudo-column, which lets you specify which daily tables to include in your query.
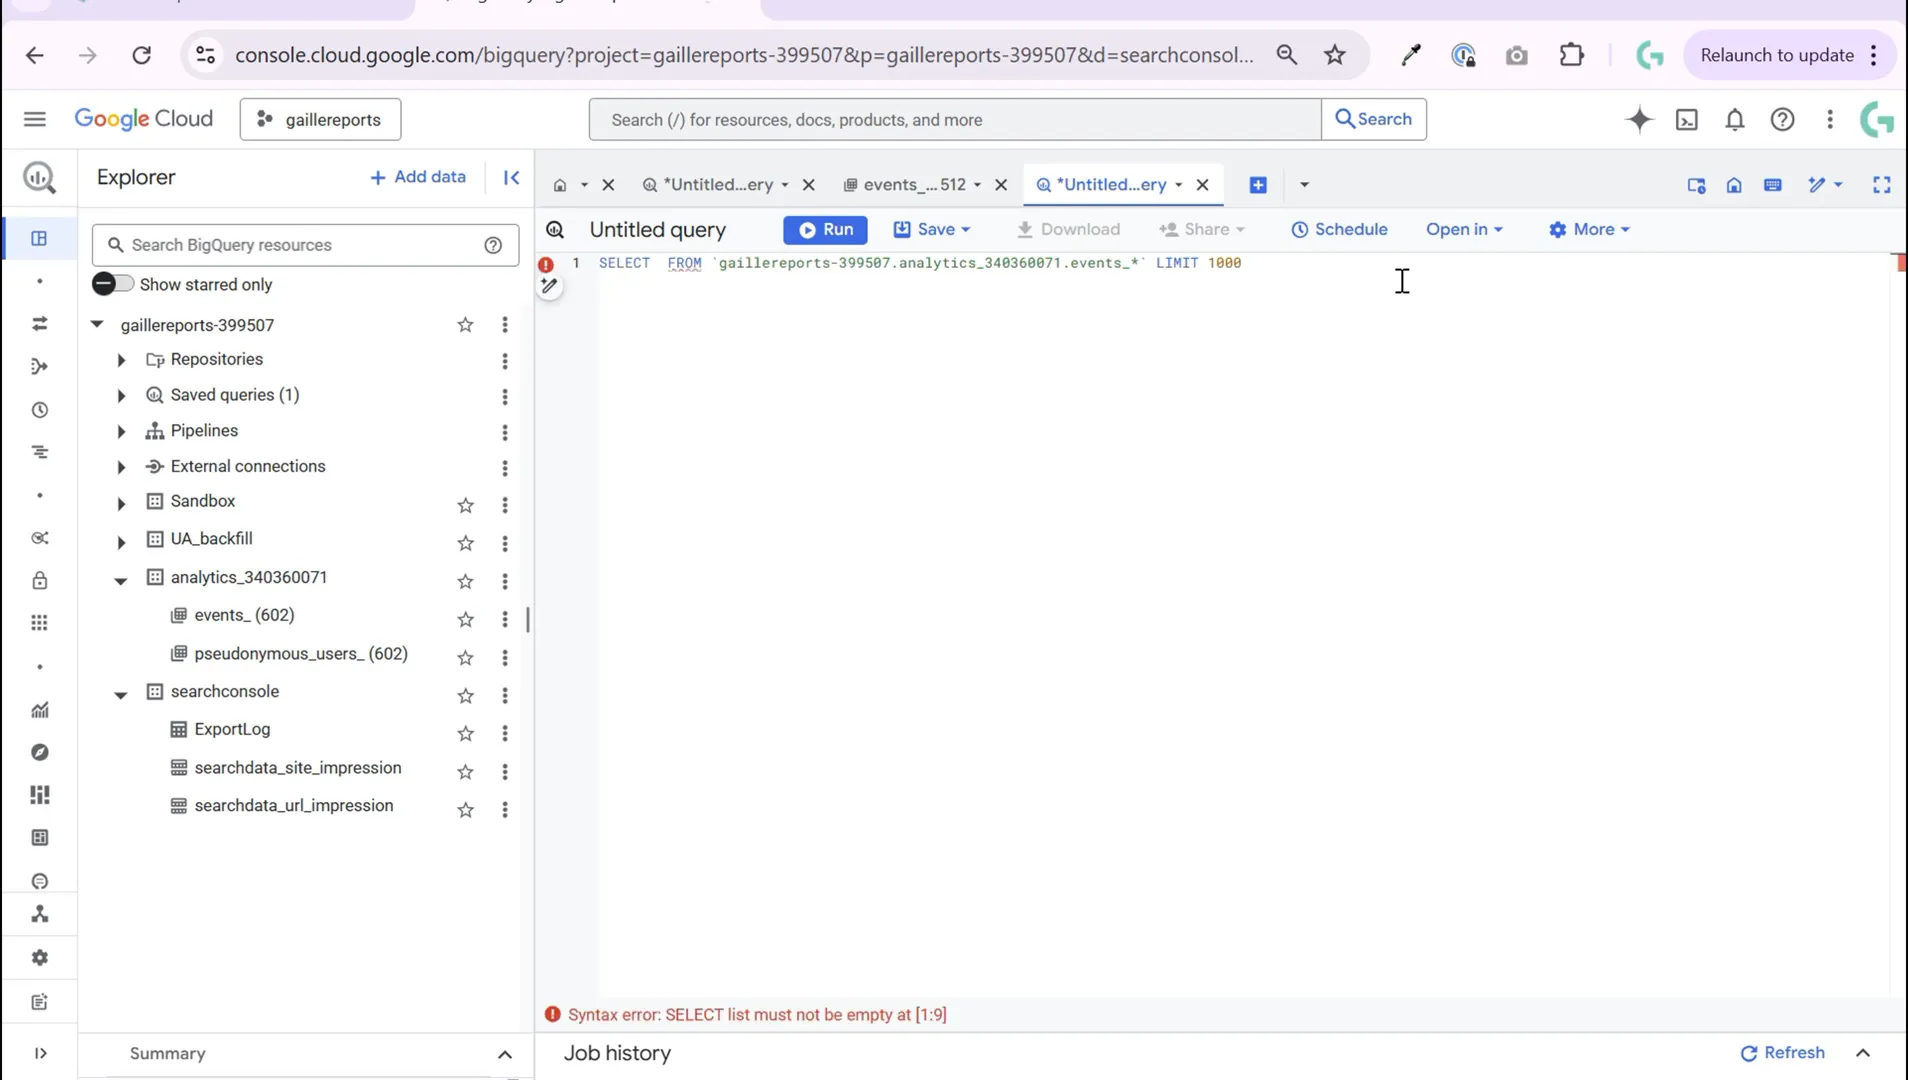
For example, if you want to analyze data only from May 1st to yesterday, you can use the _TABLE_SUFFIX filter to limit the query accordingly.
Step 3: How to Write Your First Query Using _TABLE_SUFFIX
Let’s break down the structure of a typical SQL query you’ll write in BigQuery for GA4 data:
- SELECT: Choose the fields you want to retrieve or calculate.
- FROM: Specify the table(s) you’re querying.
- WHERE: Add conditions to filter rows or tables.
- GROUP BY: Aggregate data by one or more fields.
- ORDER BY: Sort the results.
To start, you can explore the fields available in your GA4 events table by clicking on the table in the BigQuery console. You’ll see many fields, including nested parameters with key-value pairs.
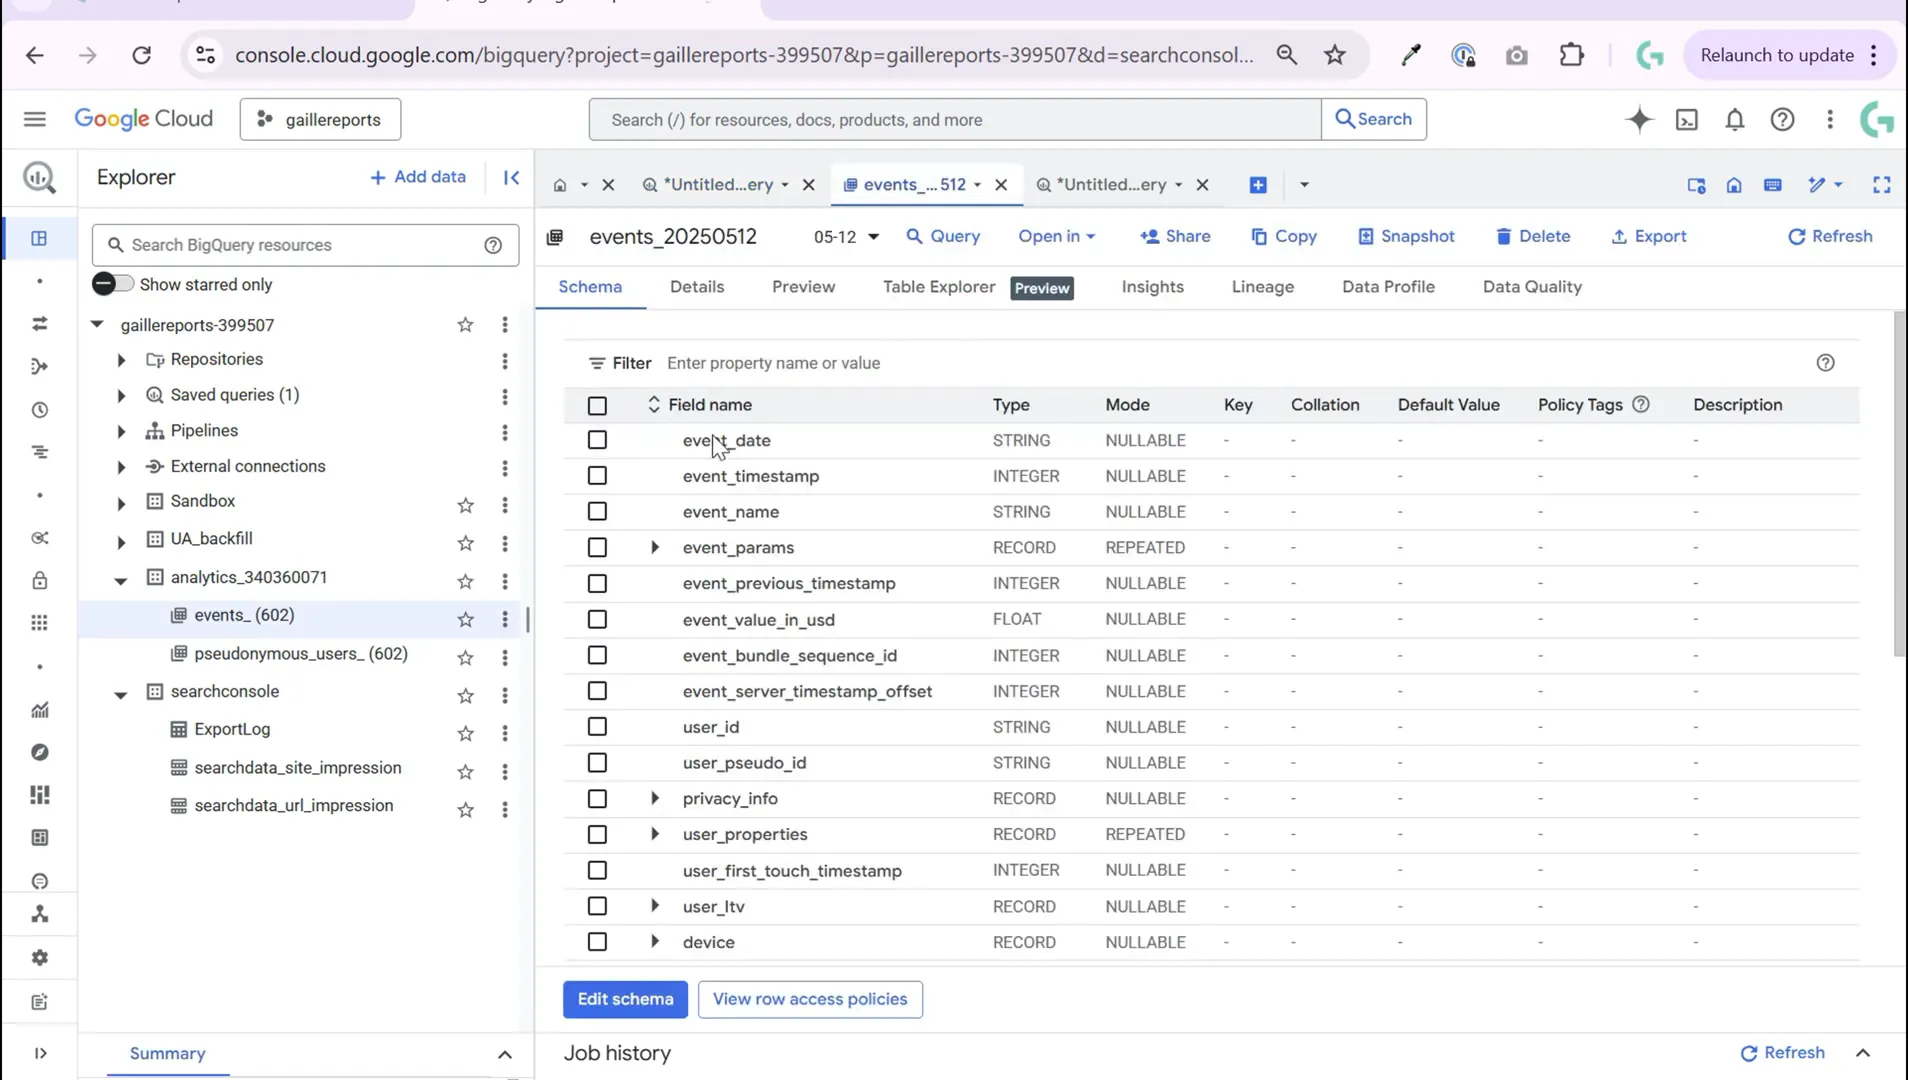
For your first simple query, let’s count how many times each event name occurred over a specific date range. Here’s the SQL you can use:
SELECT
  event_name,
  COUNT(*) AS event_count
FROM
  `your_project.your_dataset.events_*`
WHERE
  _TABLE_SUFFIX BETWEEN '20230501' AND FORMAT_DATE('%Y%m%d', DATE_SUB(CURRENT_DATE(), INTERVAL 1 DAY))
GROUP BY
  event_name
ORDER BY
  event_count DESC
Let me explain the key parts:
events_*— This wildcard includes all daily tables._TABLE_SUFFIX BETWEEN '20230501' AND ...— This filters the tables by suffix (date) to only include May 1st through yesterday.COUNT(*)— Counts the number of event occurrences.GROUP BY event_name— Aggregates counts by event name.ORDER BY event_count DESC— Sorts events by popularity.
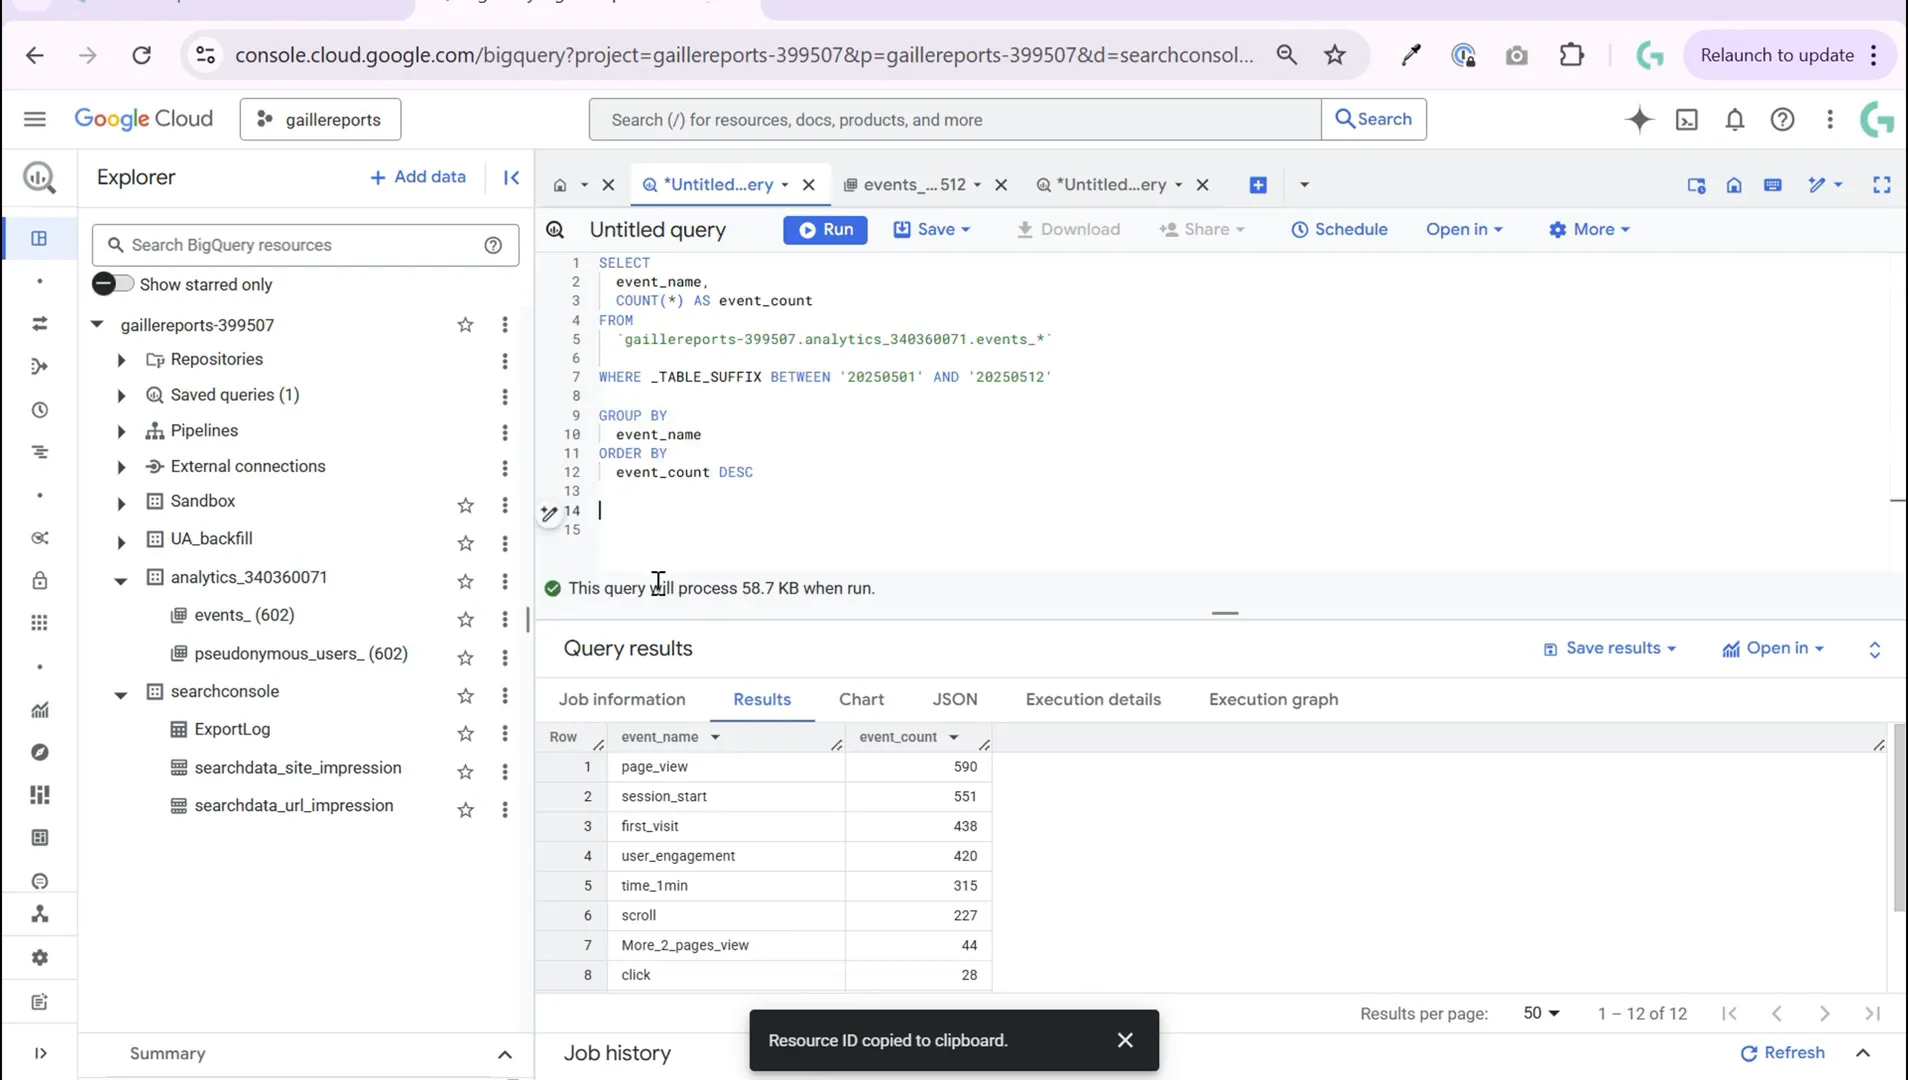
Notice the difference in data processed: this query scanned only 58 KB, whereas querying all tables without filtering scanned 175 MB. That’s a huge saving in cost and query speed!
Step 4: Adding Date Breakdown and Filtering by Event
Once you’re comfortable with basic queries, you can expand them to include the event date for daily breakdowns:
SELECT
  event_date,
  event_name,
  COUNT(*) AS event_count
FROM
  `your_project.your_dataset.events_*`
WHERE
  _TABLE_SUFFIX BETWEEN '20230501' AND FORMAT_DATE('%Y%m%d', DATE_SUB(CURRENT_DATE(), INTERVAL 1 DAY))
GROUP BY
  event_date,
  event_name
ORDER BY
  event_date,
  event_count DESC
This query groups events not just by name but also by the date they occurred, giving you a time series view.
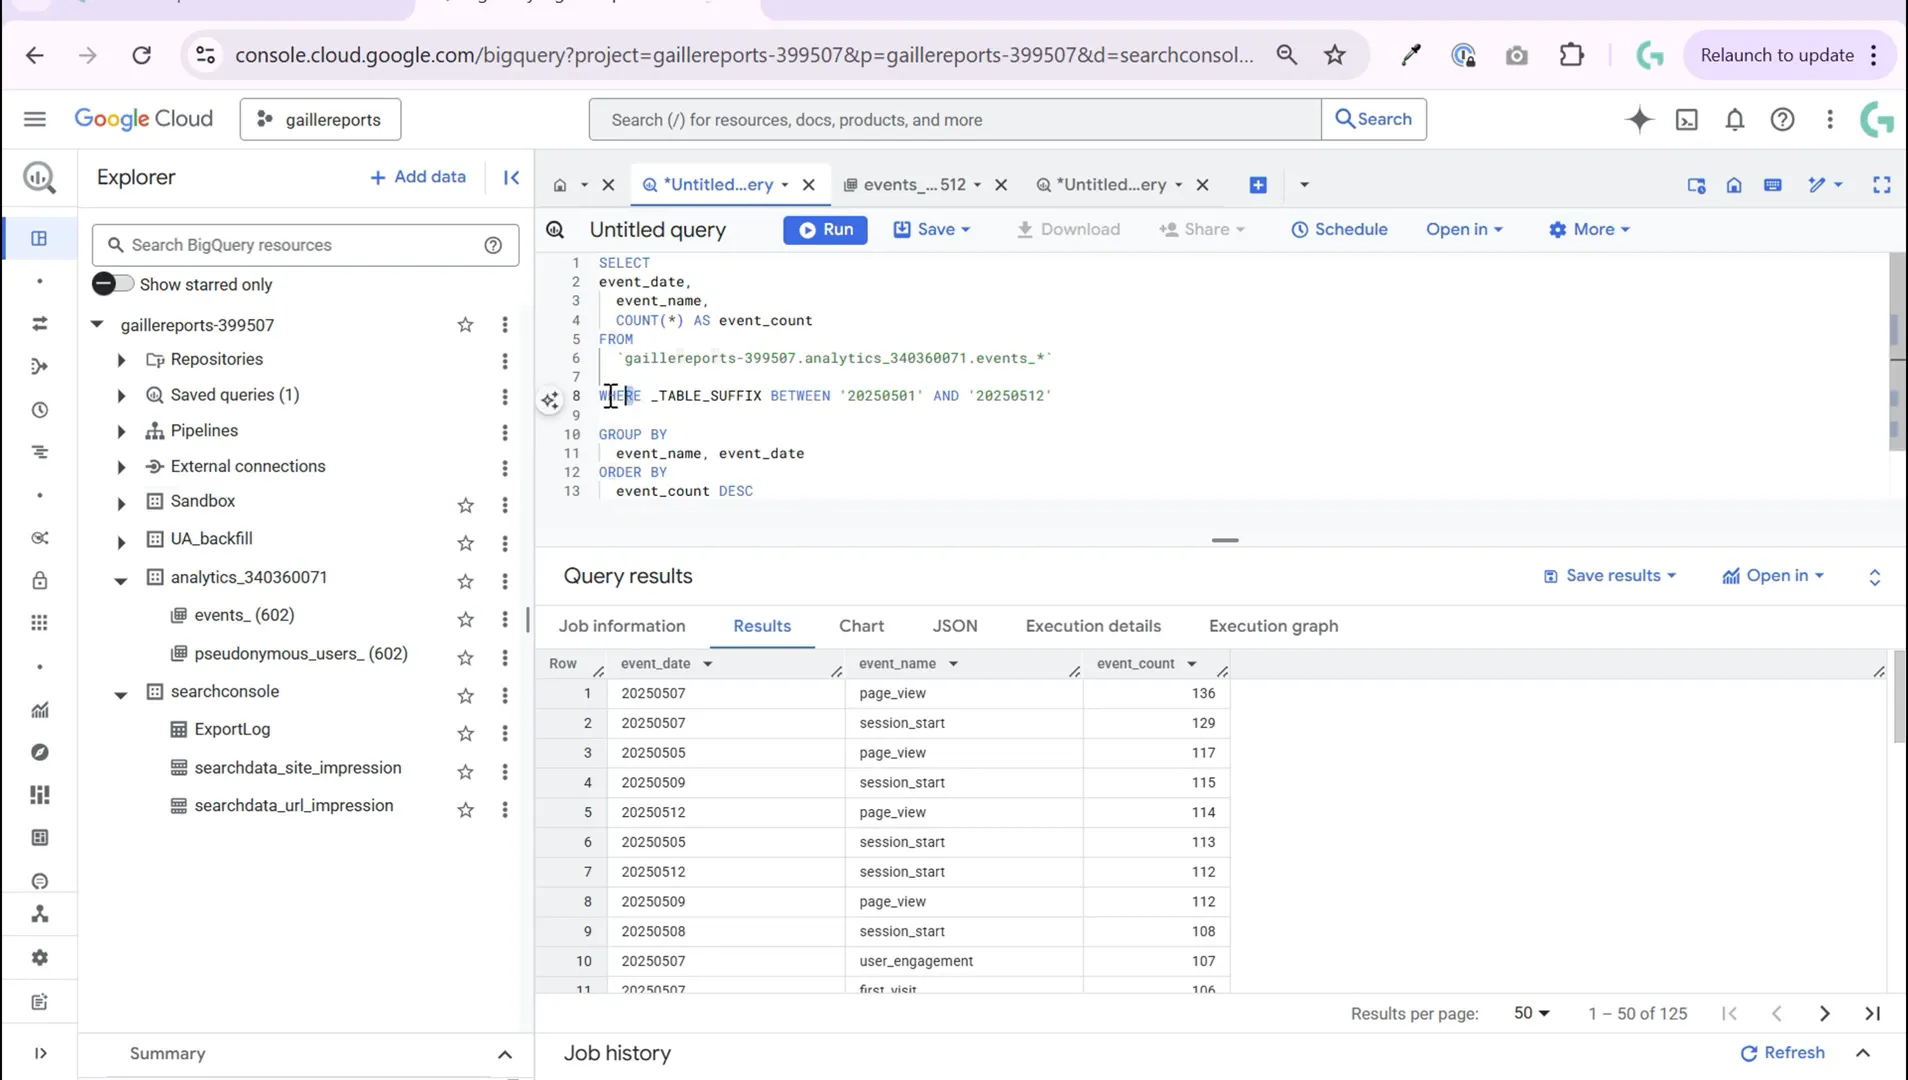
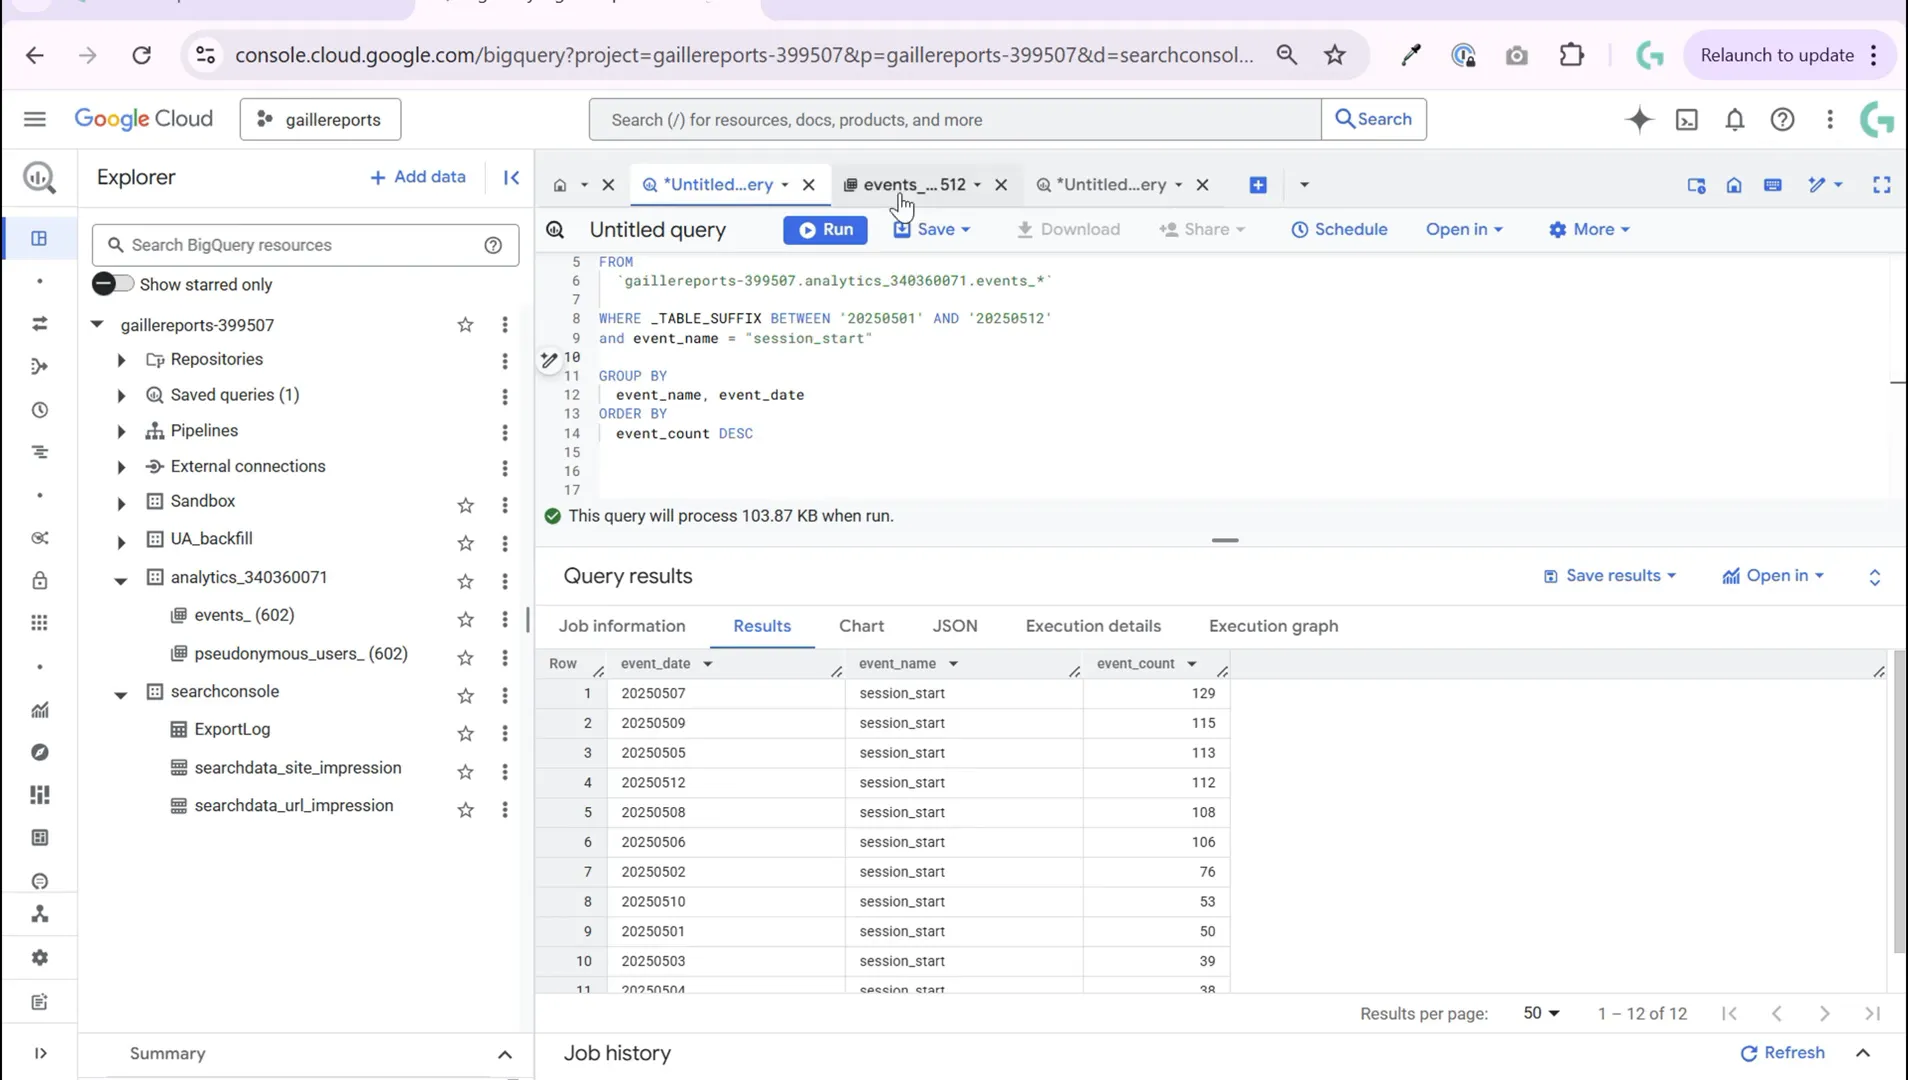
If you want to focus on specific events, for example, session start events, add a WHERE clause for event_name:
SELECT
  event_date,
  COUNT(*) AS session_starts
FROM
  `your_project.your_dataset.events_*`
WHERE
  _TABLE_SUFFIX BETWEEN '20230501' AND FORMAT_DATE('%Y%m%d', DATE_SUB(CURRENT_DATE(), INTERVAL 1 DAY))
  AND event_name = 'session_start'
GROUP BY
  event_date
ORDER BY
  event_date
Step 5: Tips for Efficient Querying and Cost Savings
Using _TABLE_SUFFIX is incredibly helpful in making your queries efficient and cost-effective. Here are some tips to keep in mind:
- Limit your date range: Only query the tables you need. Avoid scanning your entire GA4 history unless necessary.
- Use wildcards wisely: Wildcards can be powerful but dangerous if they cause you to scan too much data.
- Explore table schema: Familiarize yourself with the available fields and nested parameters in your
eventstable to write precise queries. - Test with small date ranges: Start with a week or a month of data before scaling up.
- Use BigQuery functions: Functions like
FORMAT_DATEandDATE_SUBhelp automate date filtering dynamically.
For more advanced date functions in BigQuery, such as finding the first and last day of a month, check out my detailed guide here.
Step 6: Next Steps and Additional Resources
Now that you know how to query GA4 data in BigQuery using _TABLE_SUFFIX, you can start building custom reports and dashboards in Looker Studio or other tools. If you want to learn how to connect BigQuery to Looker Studio easily, I recommend my beginner-friendly tutorial available here.
Also, stay updated with the latest Looker Studio features by reading about What’s New in the Looker Studio Update. This will help you create even more powerful and modern dashboards.
Conclusion
Querying GA4 data in BigQuery can seem intimidating at first, but by understanding the daily table structure and using the _TABLE_SUFFIX pseudo-column, you’ll save both time and money. This method lets you filter data by custom date ranges efficiently, making your data analysis more manageable and insightful.
Remember, start with simple queries to explore your data, then gradually add complexity like date breakdowns and event filters. Don’t be afraid to experiment and refine your SQL skills—BigQuery is a powerful tool once you get the hang of it.
If you found this tutorial helpful, please subscribe to my blog for more tips and templates about Looker Studio, Google Sheets, and marketing analytics. You can also leave questions or comments—I’m happy to help you on your data journey!
Happy querying!
