
Complete Guide to the Google Ads Extended Analytics Template

Google Ads is a crucial tool for many reasons, particularly for optimizing advertising campaigns and ensuring you’re getting the best return on investment. I’ve designed a Google Ads Extended Analytics report template that will give an extended look on your ads account. Particularly it will help you keep campaigns and ads groups, keywords and audience, auctions and time on track.
Check out the video overview here:
About the report template
The report consists of 5 pages – Insights, Campaigns & Ads groups, Keywords, Audience and Auctions & Time. As you can see, there is a Google Ads data filter you will have to update when starting to work with the dashboard to pull up your analytics data.
Generally, this report is very easy to use and even easier to set up owing to the Google Ads filter I’ve mentioned above.
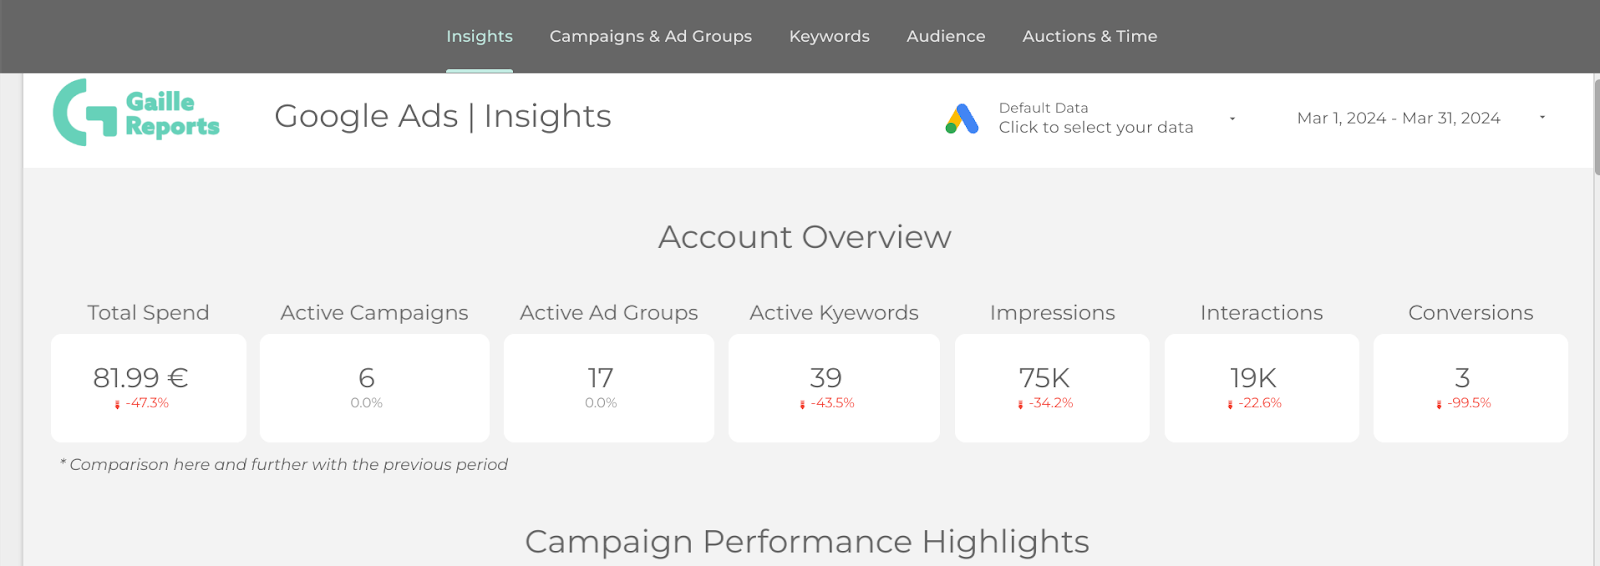
Insights page
Basically, at the very beginning of the dashboard I placed an account overview section that will give you a general look on what’s going on. In this section we have Total Spend, Active Campaigns, Active Ad Groups, Active Keywords, Impressions, Interactions and Conversions. In each score box you can see a percentage comparison of a certain metric with the previous period.
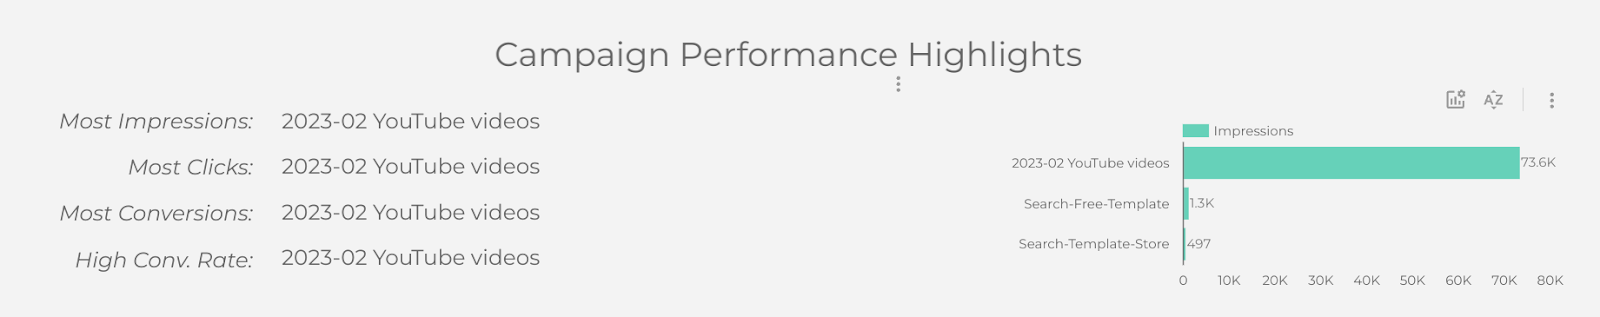
The next section of the first page is Campaign Performance Highlights. Here we can see the performance of the most effective campaigns. To clarify, you can see campaigns that have the most impressions, campaigns that have the most clicks etc., but in my case it’s the same campaign.
On the right side we can see top-3 campaigns based on any metric (owing to the optional metrics)

Likewise, in the following section you can check the most effective Keywords and Search Terms. In the chart on the right side you can use the arrows to switch from Keywords and Search Terms and back.
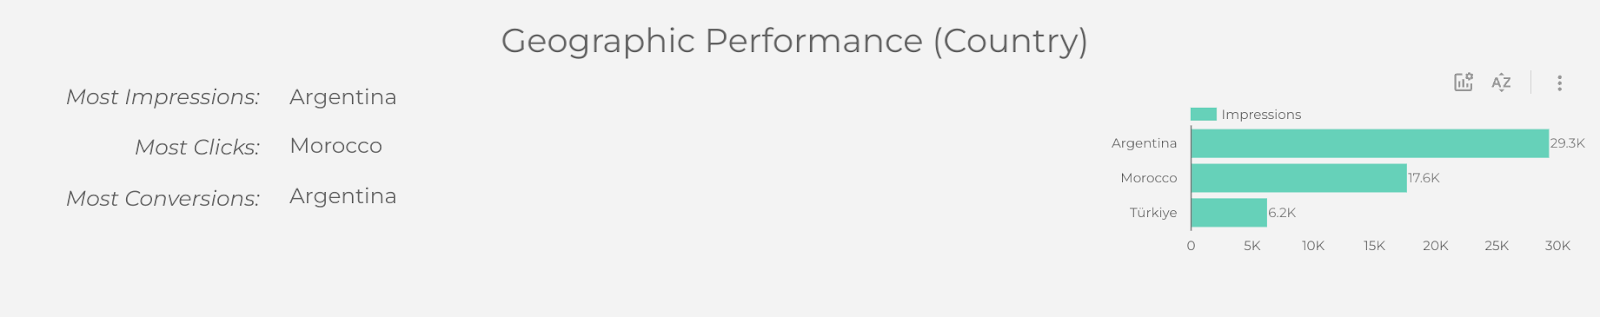
Then we have a geographical breakdown for impressions, clicks and conversions.

Followingly, you can check out the most effective time and day of the week of your ads, which will be extremely useful while launching your future ad campaigns.
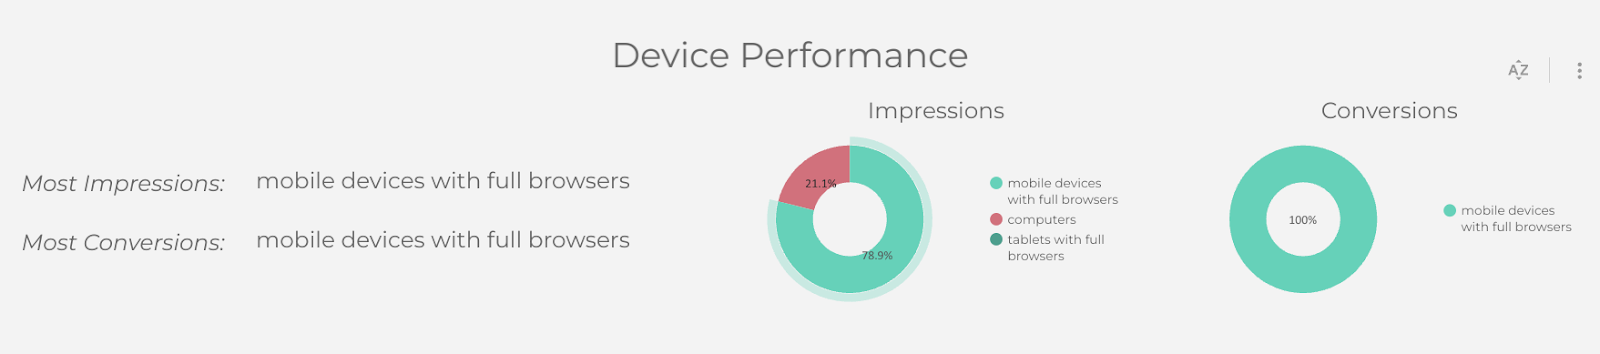
On this page you can also find a device performance overview…
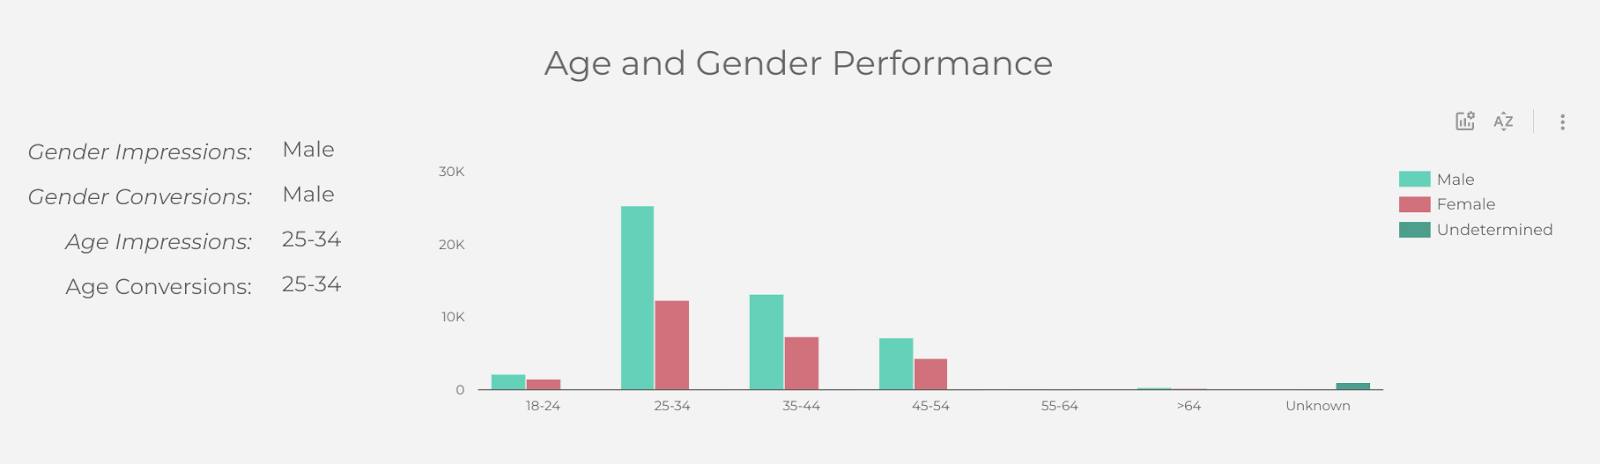
…as well as age and gender performance overview! It will help you understand your target audience much better.
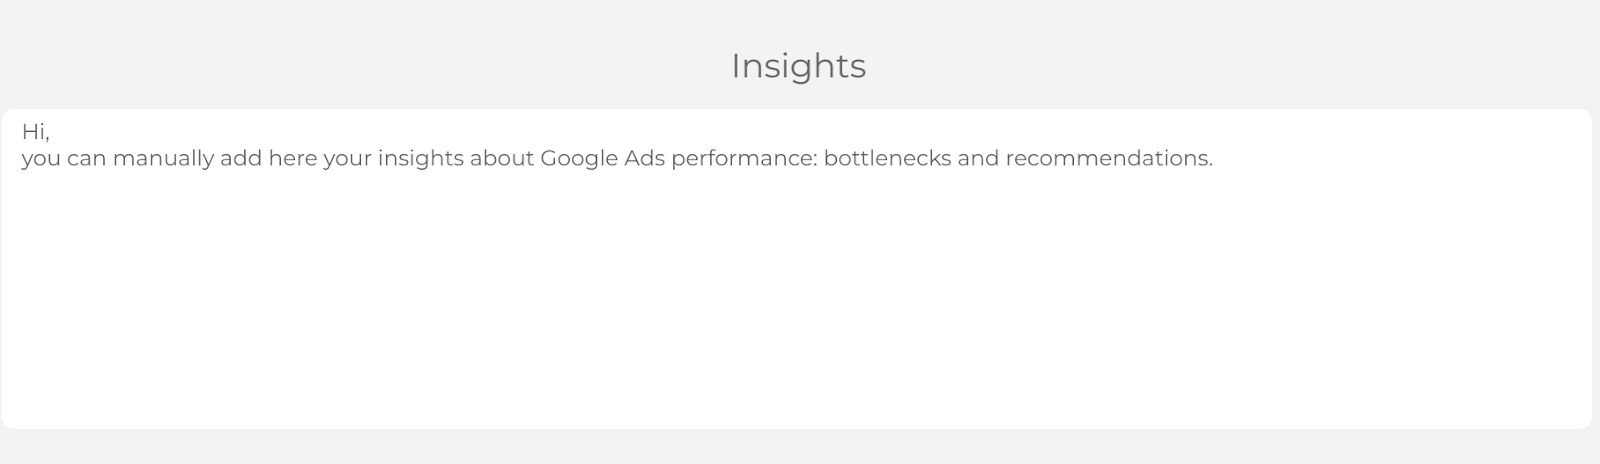
In the bottom of the page I’ve placed a field for your personal insights and notes.
Campaigns & Ad groups
Let’s delve into campaigns and ad groups to have a detailed and deep understanding of these aspects.

Primarily, on the very top of this page we can see a row of filters you can apply to this page, such as channel type, campaign, ad group, audience and device.
The first section of this report is Key metrics concerning campaigns. Here we can check the Cost, Impressions, Interactions, CTR, average CPC and Conversions. In each score box you can see a month over month and year over year percentage comparison.

In the same section we have a line chart to check the performance of each metric over month. Additionally, there is an optional metrics function enabled so you can use it to change metrics in the chart.
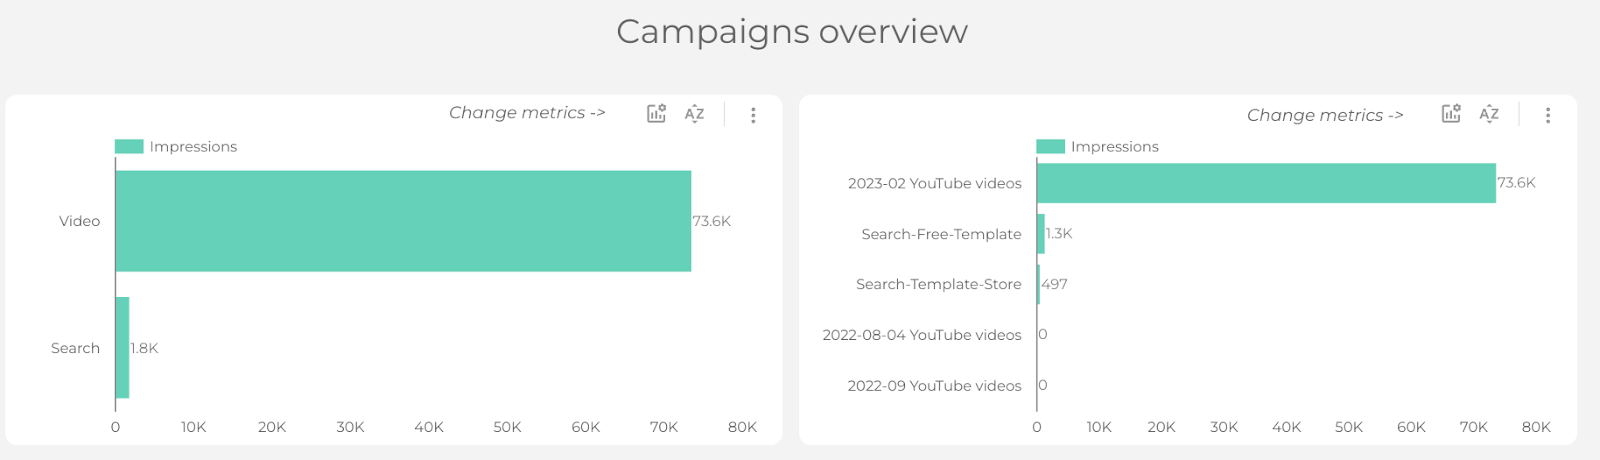
Next, we have a campaign overview. The first chart shows us the channel breakdown and the second – campaigns themselves.

Here goes the campaigns’ detailed analysis. You can see a type, status, cost, impressions and many other metrics corresponding to each ad campaign.
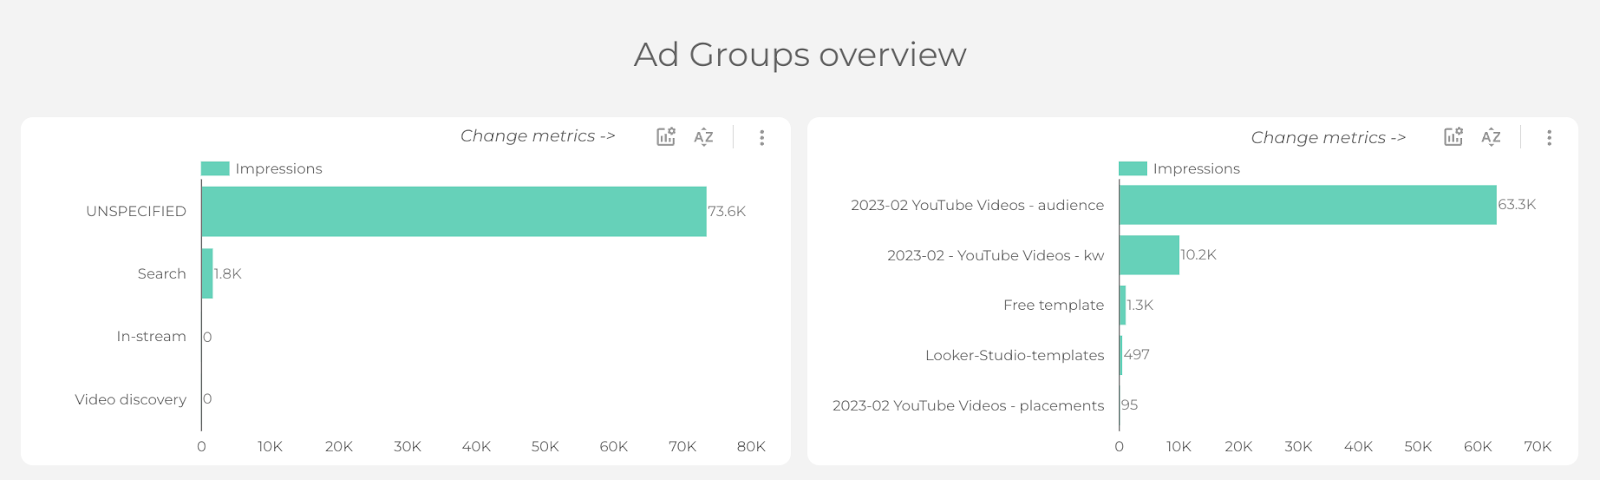
The next thing we have is an Ad Groups overview. Firstly, we see a chart with the type and the second one – with the exact name of the ad group.

In the bottom of the page we have an ad group detailed analysis so that you can see full data about the performance of each ad group.
Keywords
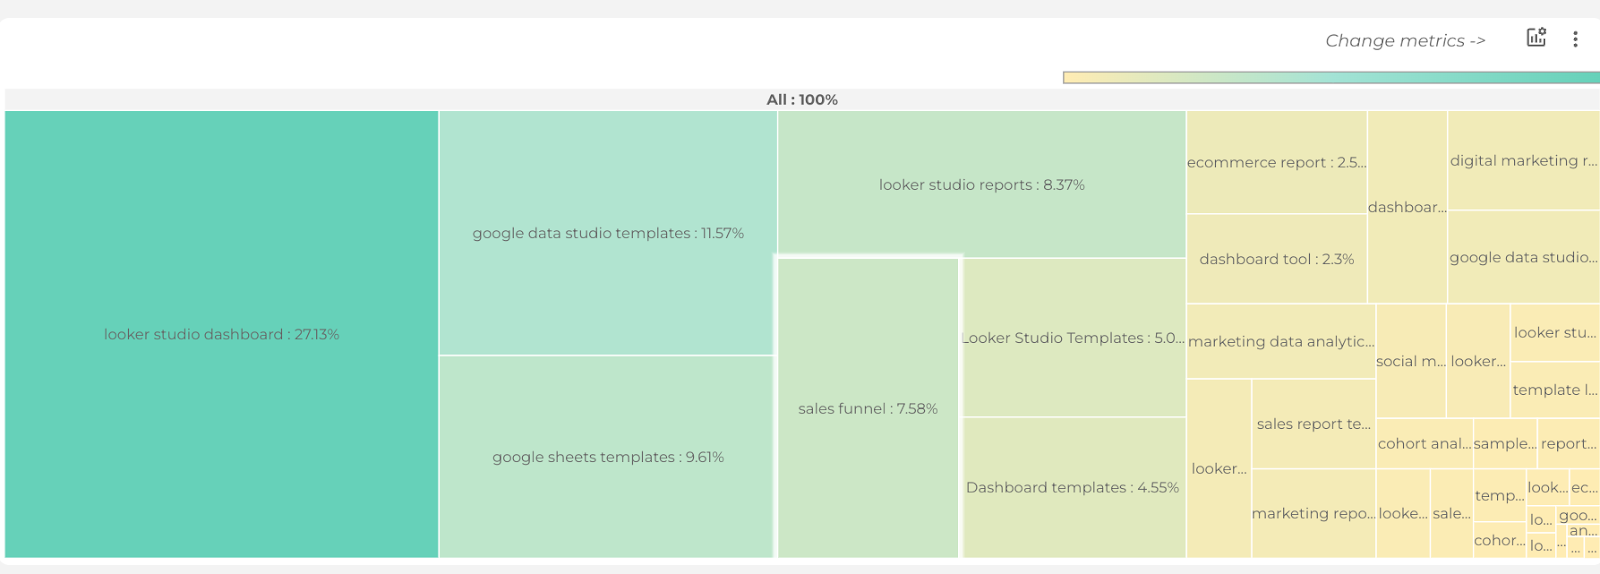
The Keywords page starts with the filters and the treemap chart with the most used keywords in your ad campaigns. The darker and the bigger the cell is – the more the keyword was used. When selecting a cell, you can check out the impressions or other metrics, using the optional metrics feature.
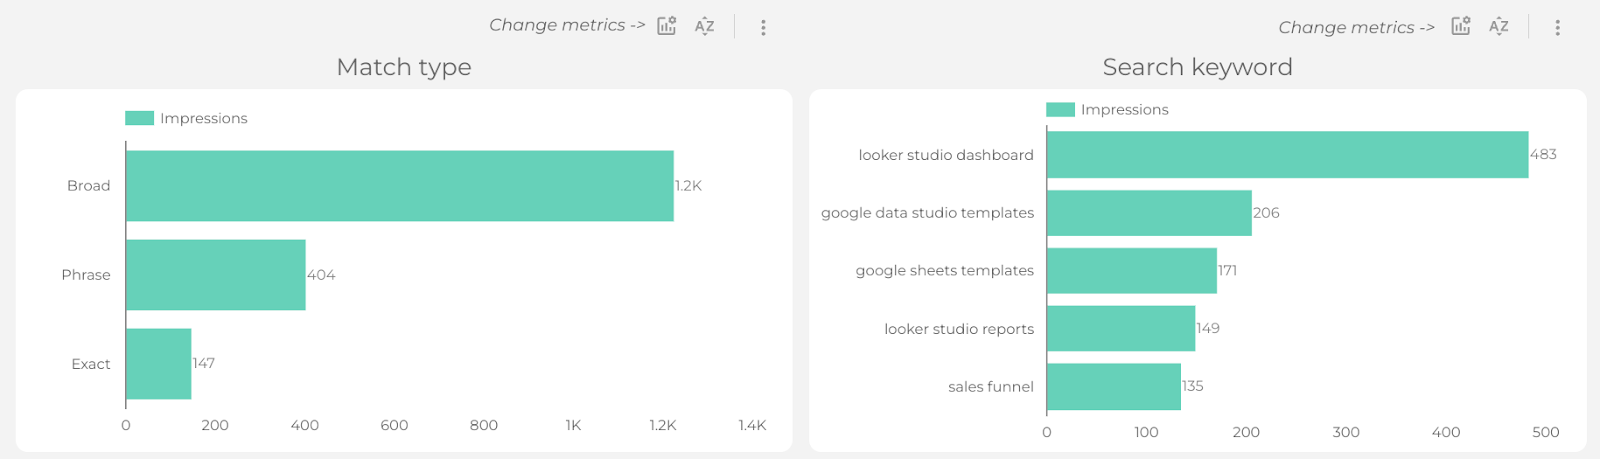
Then we have two charts – with match type and search keywords. There are 3 match types – broad, phrase and exact. And search keywords gives us an idea of what are the keywords with the best performance.

Additionally, there is a keywords detailed analysis – it shows you a performance of all the keywords you’ve used.
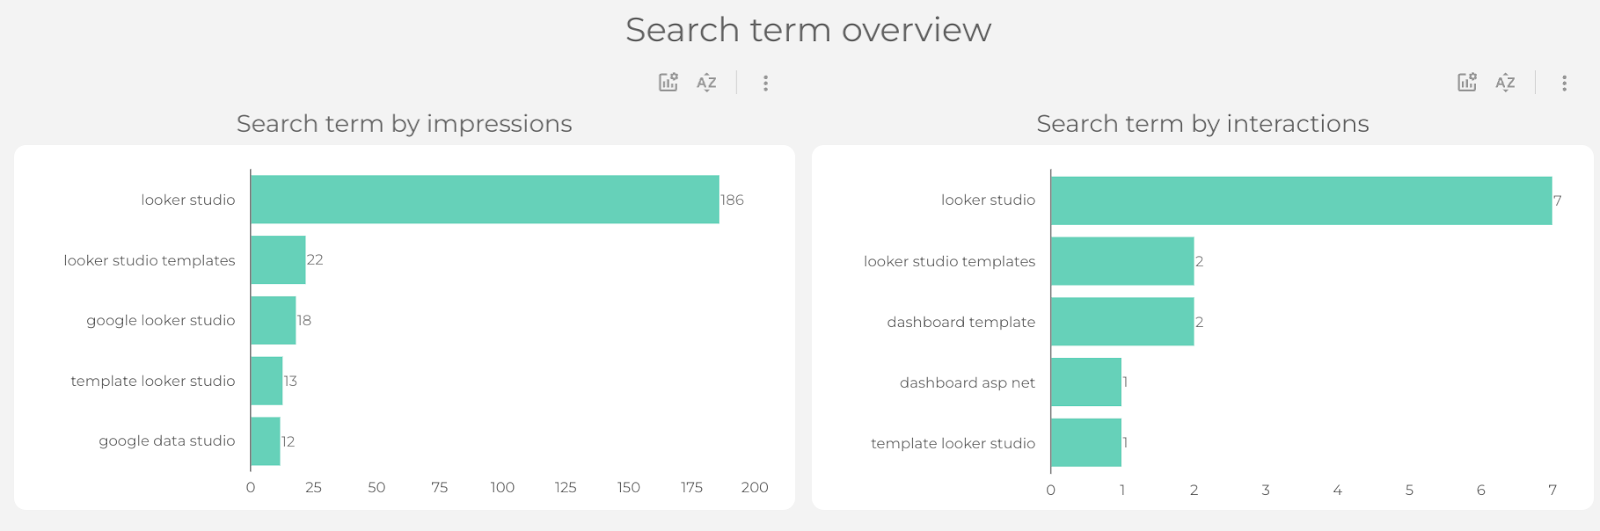
Let’s move to the search term section. The first chart gives us a chance to check everything about search terms and impressions, and the second one – the rest of the metrics. Reminding you to check out the optional metrics for each chart.
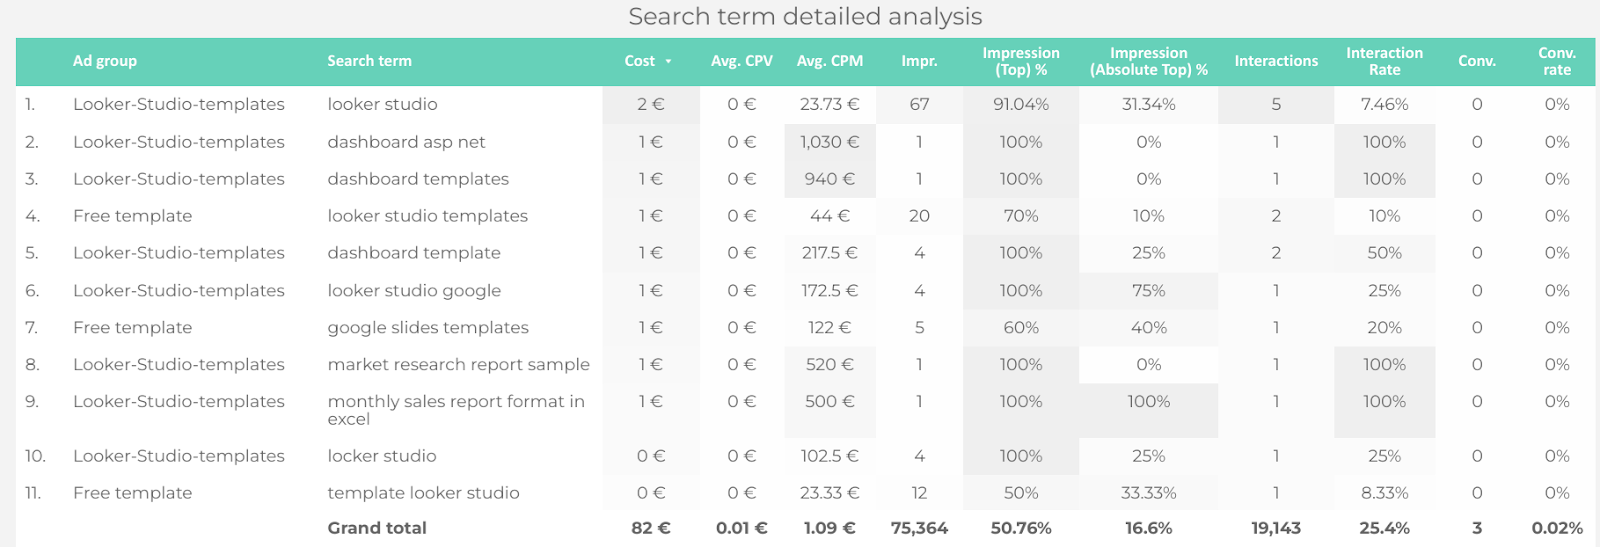
In the end of the page we have a search term for detailed analysis, similarly to the previous sections.
What is special about it? You can export this table and work with it separately in Google Sheets.
Audience
This page starts with filters such as Campaign, Audience Type, Audience, Gender and Age. The first section of this dashboard is dedicated to general audience overview.
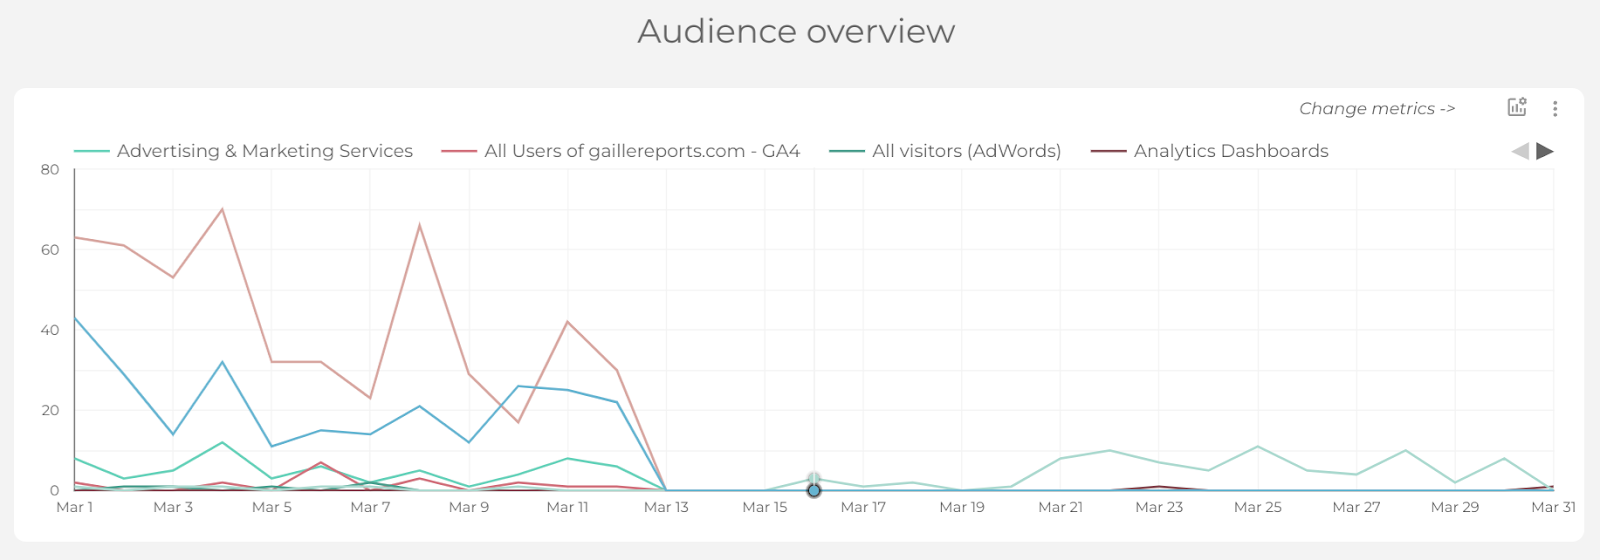
This chart shows us different metrics’ performance of each audience type. By default it’s Impressions but you can change it in optional metrics.
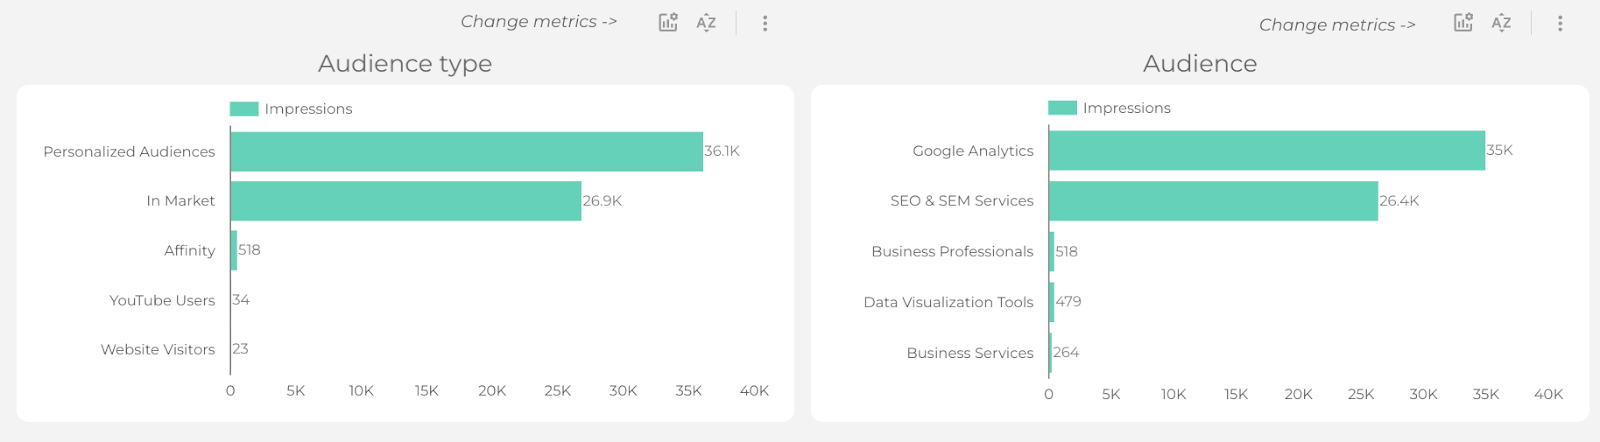
Here go Audience Type and Audience bar charts.
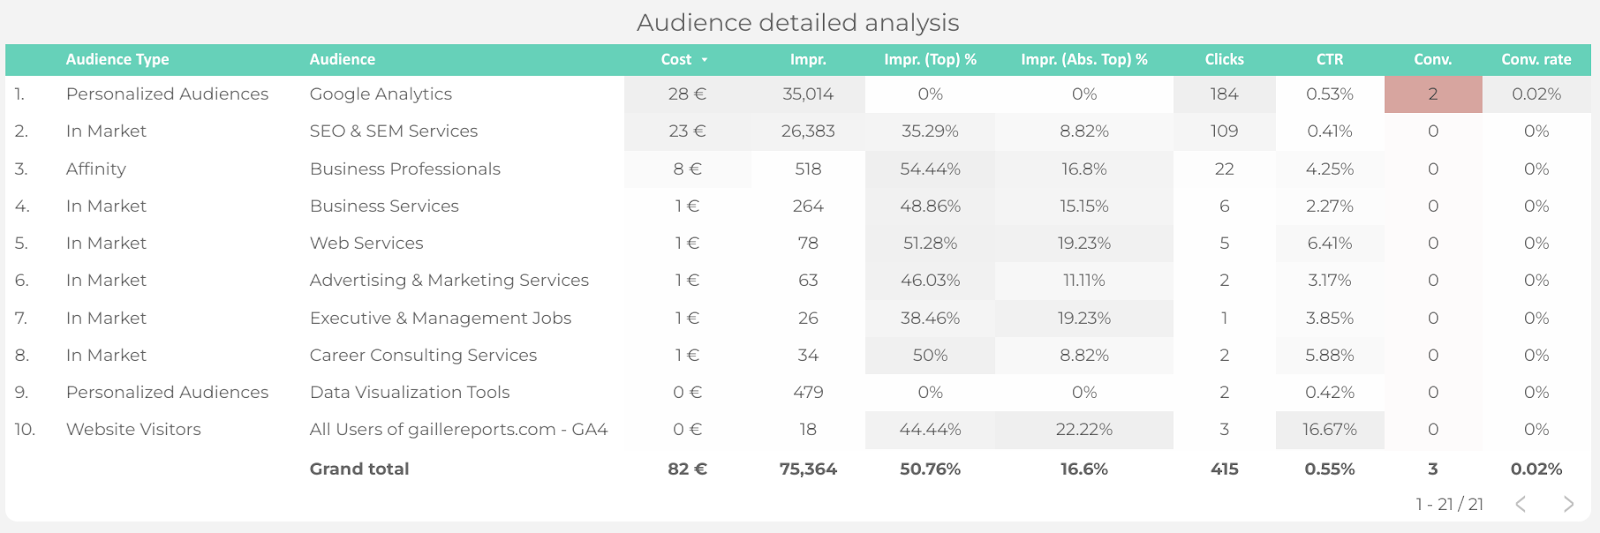
And then we have an audience detailed analysis.
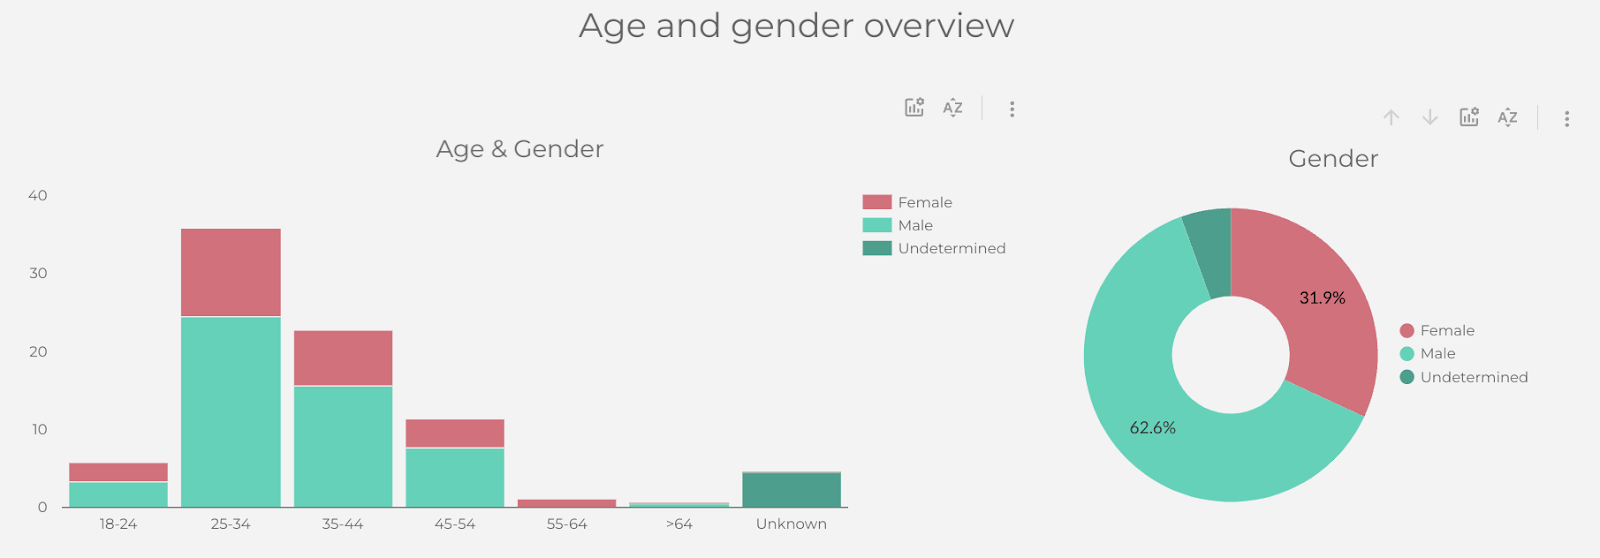
Now we’re moving to the Age and gender section, where we can see the ratio of men and women and their share in each age category.

Followingly, we have the extended table for age and gender.
Auctions and Time
This page will be useful for big ads accounts. It is dedicated to competitors.
On the top we have several filters such as Channel type, Campaign, Ad type, Ad group and Search Keyword.

As you can see, I don’t have any data here. But the idea of these charts in the first section of this page is to compare your impression rate with your competitors’ one.
Also, I’ve added some notes and explanations to make your interaction with the dashboard easier.
Followingly, on this page we have a detailed analysis.
The next section is about Day and Time. It also starts with the filters like Channel type, Campaign, Ad Group, Day of week and Hour of day.
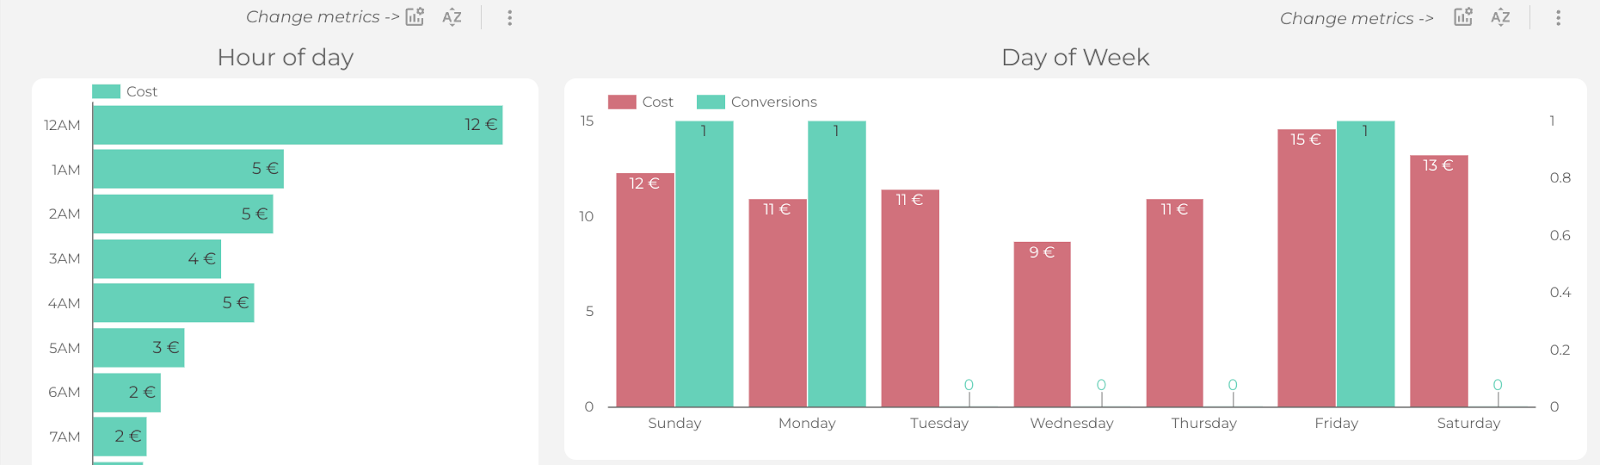
In the left chart you can see the changes in cost (and other metrics) throughout the day starting from 12 AM finishing at 11 PM. Then, we have a chart that compares the metrics over the week. By default the metrics are Cost and Conversion, but it’s customizable.
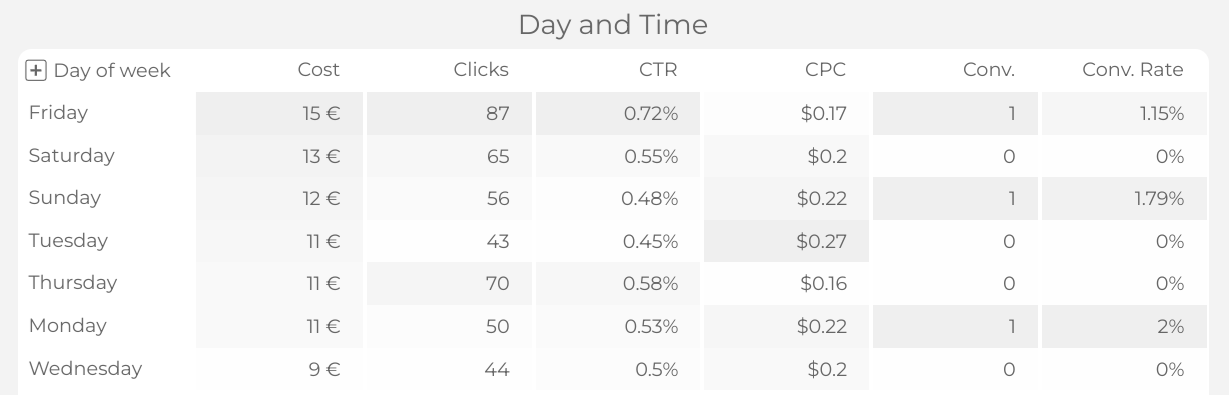
Lastly, we have a detailed table with day and time data.
Summary
In this report you have all the necessary information to check your Google Ads analytics. It will be useful for solo as for agency marketers. This dashboard is really easy to customize and make it even more easy to work with.
Hope you enjoyed reading this Google Ads Extended Analytics template overview! Check this and many other templates in my template store.