
Cohort Analysis in Looker Studio and Google Sheets Template Overview. LTV and Customer Retention

If you are owning an online store or a SaaS service, you must have heard about cohort analysis. It is one of the essential analyses for those fields. Today I would like to present to you our most popular templates from our store – Cohort Analysis template, LTV and Customer Retention.
But before reading the article, check out the video-overview:
Cohort Analysis in Looker Studio
It’s an easy to use one page dashboard that consists of three sections.
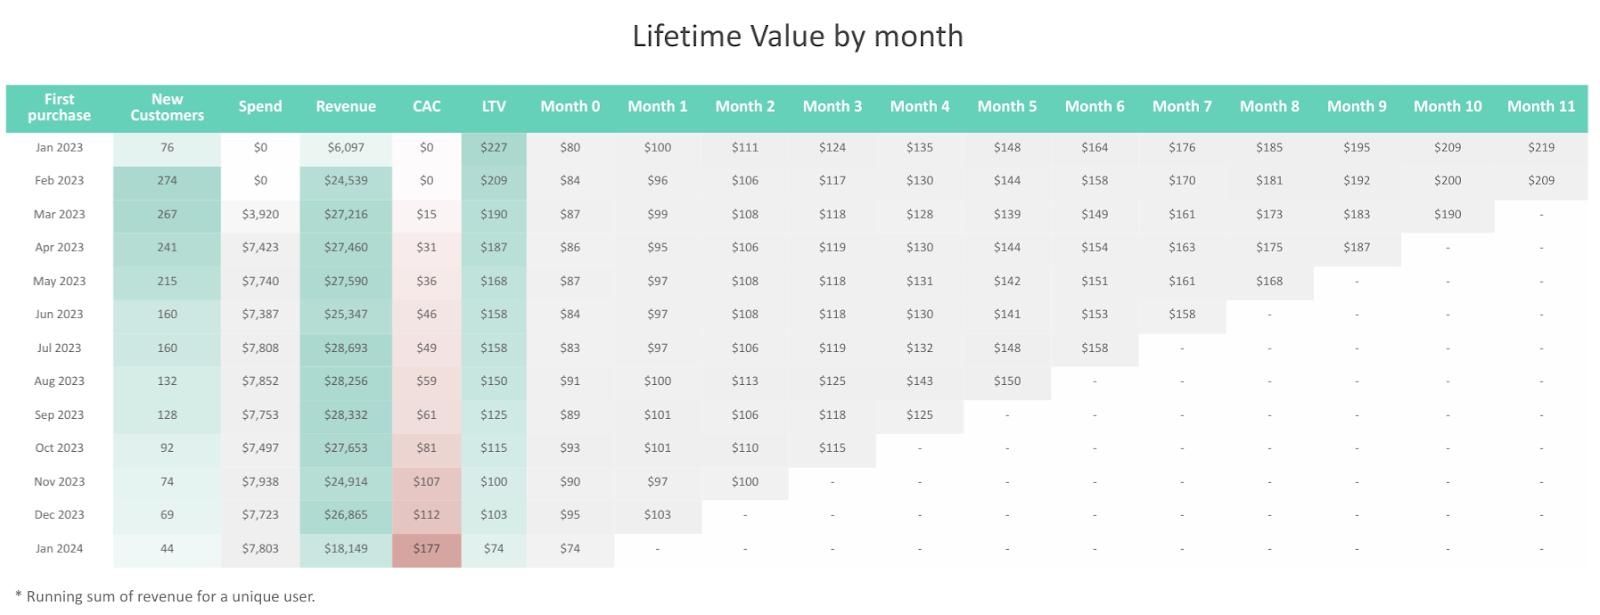
First of them is Lifetime Value by month. The table may seem to be complicated, but in fact it’s very easy to read. Here you have the date of first purchase, number of new customers you’ve claimed this month, amount of money spent from all your platforms, revenue from CRM system, Customer Acquisition Cost and Lifetime Value. As you can see, CAC is growing month by month and it means that customers come back to you (that is really good). Then, you can see the LTV of your customers month by month.
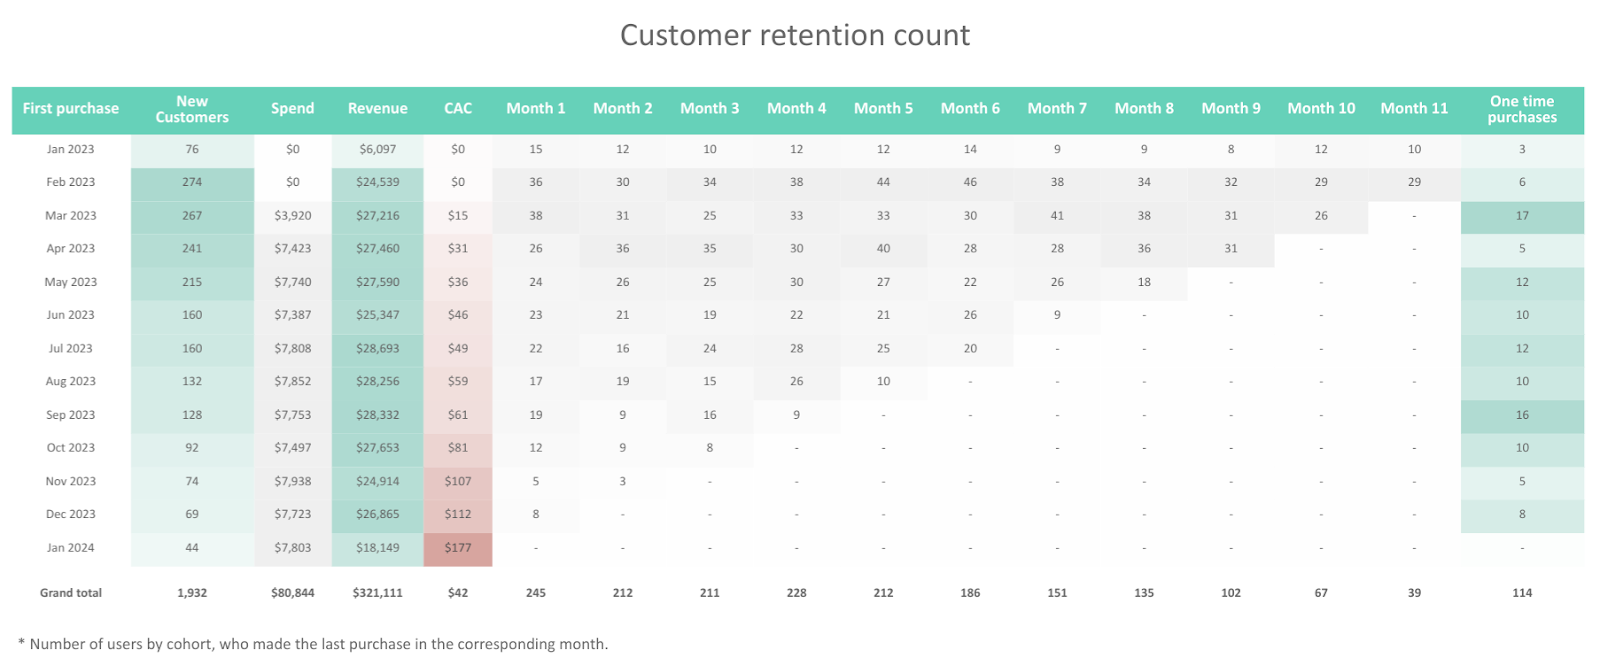
Followingly, we have a table with Customer Retention Count. It basically shows us how many customers made return purchases month by month. There is also a column that shows us how many one time purchases were made.
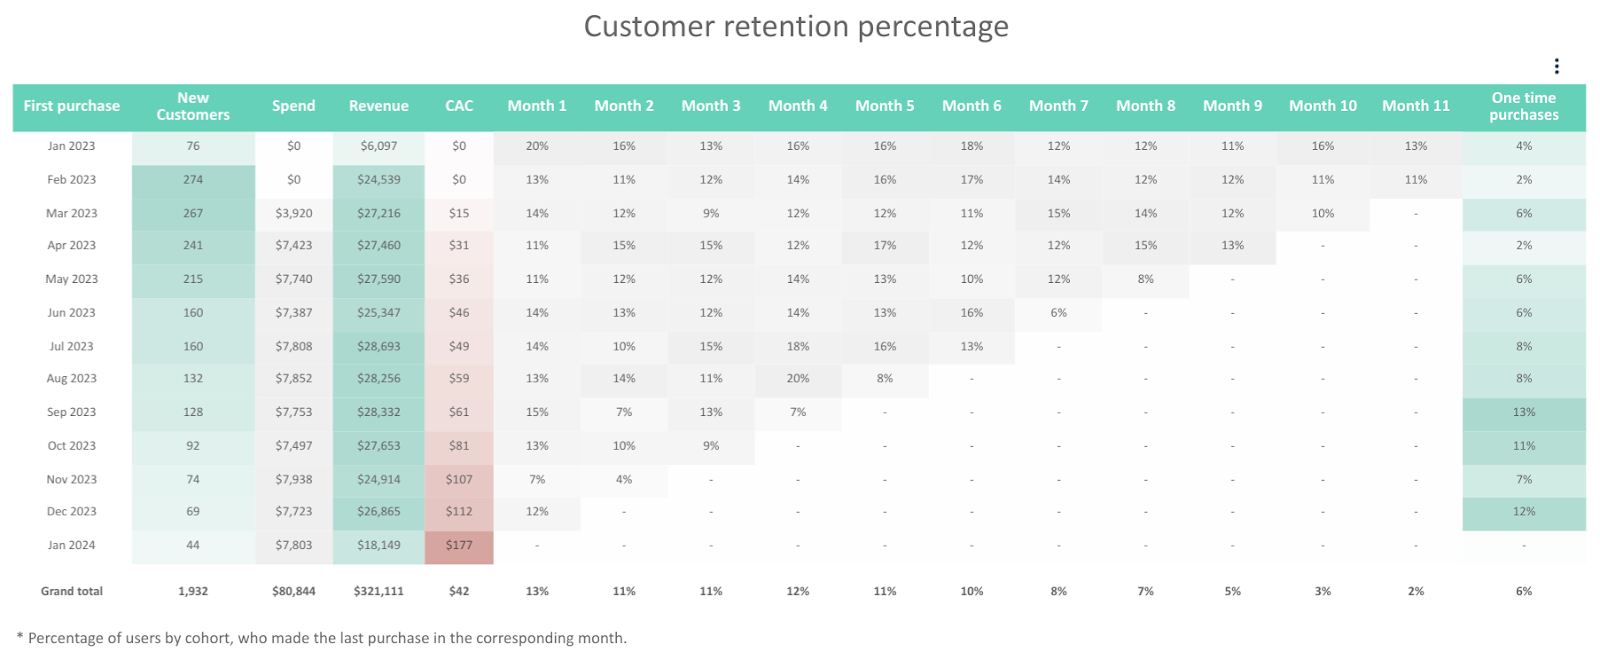
The last table presents us basically the same data from the previous two sections but this time in percentage.
Let’s see how you can insert your data to this dashboard instead of the random one used in creating the template.
Cohort Analysis in Google Sheets
This Looker Studio template was created based on two tabs of one Google Sheets. When you purchase the template, you receive a link for Looker Studio and Google Sheets. Let’s take a look at it.
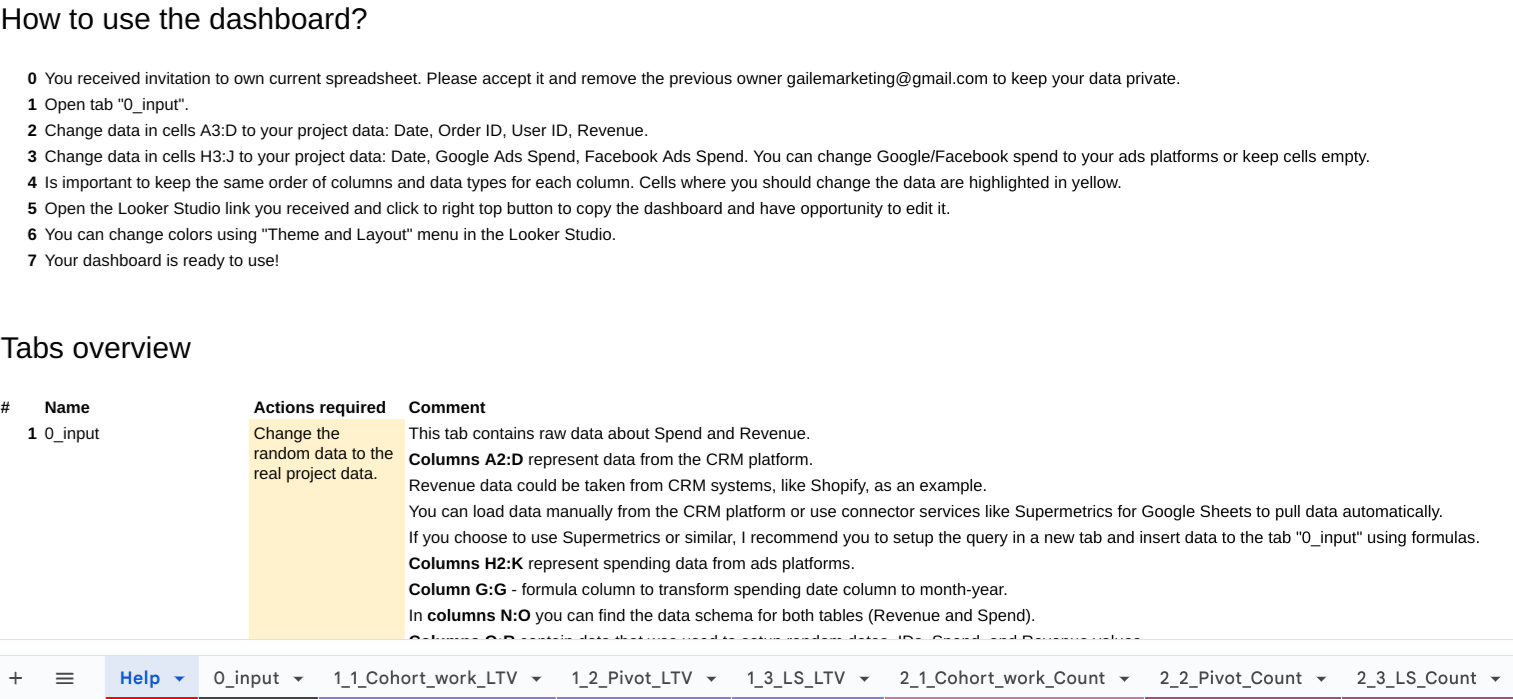
The first tab of Google Sheets you receive is a Help tab. Here you have all the necessary info to set up your data source correctly. Simply speaking, you just need to insert you data to all the yellow cells.
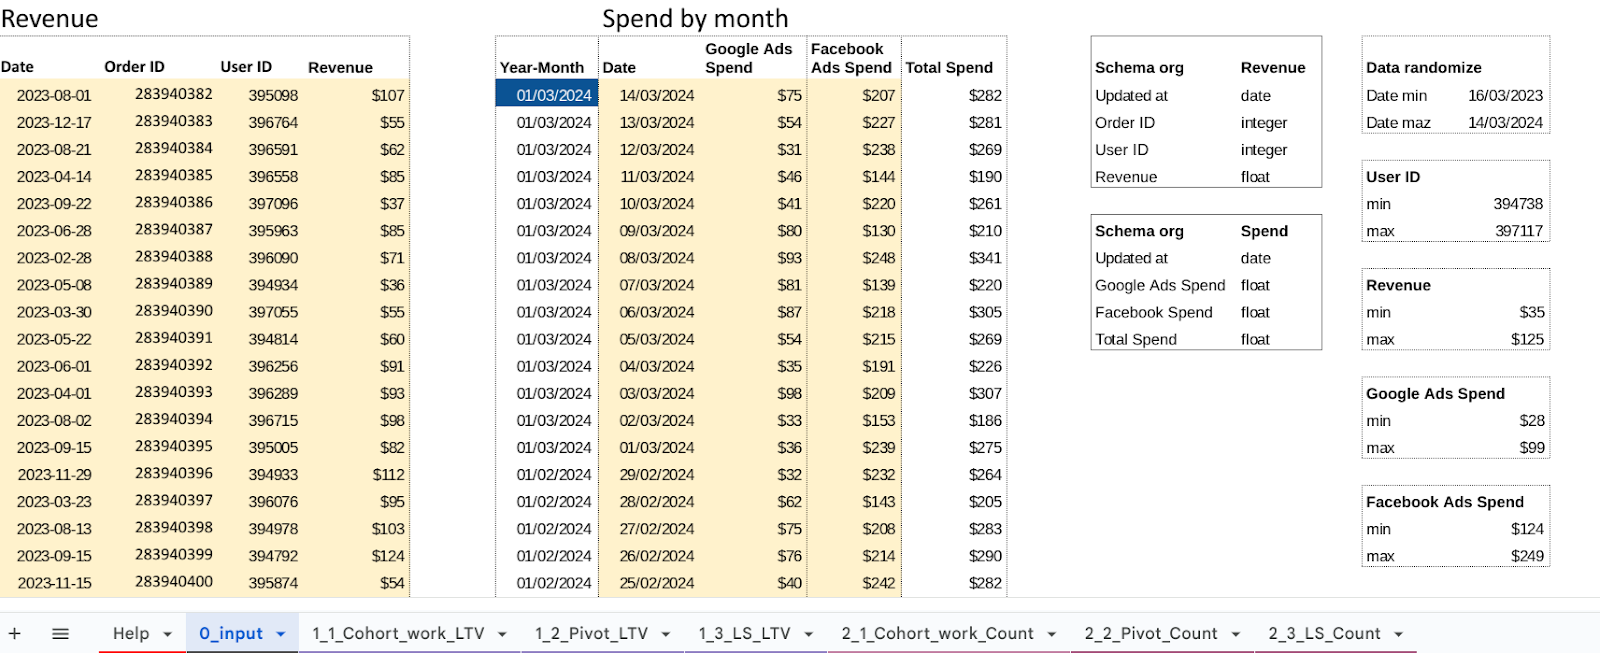
Secondly, we have an Input tab. Be careful with the dates – they have to be strictly in date format. Concerning ad platforms, in my case they are Google Ads and Facebook Ads, but you can change them to any ad platforms you use and even add more of them.
To export your data from ads platforms I highly recommend using connectors like Supermetrics, Power my Analytics and Windsor.ai. They will help you avoid manual errors and will save you a plenty of time!
Basically, that is it you need to know about the setup in Google Sheets. In the rest of the tab I use formulas and perform data transformations.
After purchasing the Cohort Analysis template – LTV and Customer Retention, make a copy of the dashboard, connect your data source and click Refresh Data in Looker Studio. It is as simple as that!
If you want to upgrade your template by adding more elements or you want it to be designed in the colors of your business, we can help you with that. We have special services like Individual design and Template Customization. Check them out in our store!
Hope you enjoyed reading this article!