
Power My Analytics Facebook Ads connector to Google Sheets

Continuing reviewing the connectors, I would like to review Power My Analytics Facebook Ads connector that I’ve mentioned in my previous article.
I’ve already connected my Google Sheets Account and I’ve already installed the add-on (read the article about it in the article about Power My Analytics GA4 connector – right here).
But for now, check out the video review:
Sidebar
As I have already authorized, I just go to a new tab and launch a sidebar. Here I have already GA4 query and I want to create Facebook Ads as well. I selected an existing template to see how it works. First of all, we need to select a Data account and a Facebook account you use or a sample account. I decided to show sample data.
Now we have configurations. Luckily, there are help windows that help us understand what kind of data we need to enter – for example, to seed and magnitude fields, but it is optional. Then you can choose the currency and don’t forget to save your settings.
Followingly, we see date range configurations. Among the list of options I selected Last 28 days not including today.
Launching
When everything is set, we start launching. But what I see! All my other tabs have disappeared and now I have only two tabs – configuration tab and a tab with data. It is really crazy. Fortunately, it’s not a working sheet.
In the Configurations tab we can see that Power My Analytics has created 17(!) queries and placed all the tables in one tab.
After the setup is finished we can see that there are a bunch of new tabs like Instructions, Desktop – Dark, Desktop – Light, Mobile – Dark and so on. Let’s observe them.
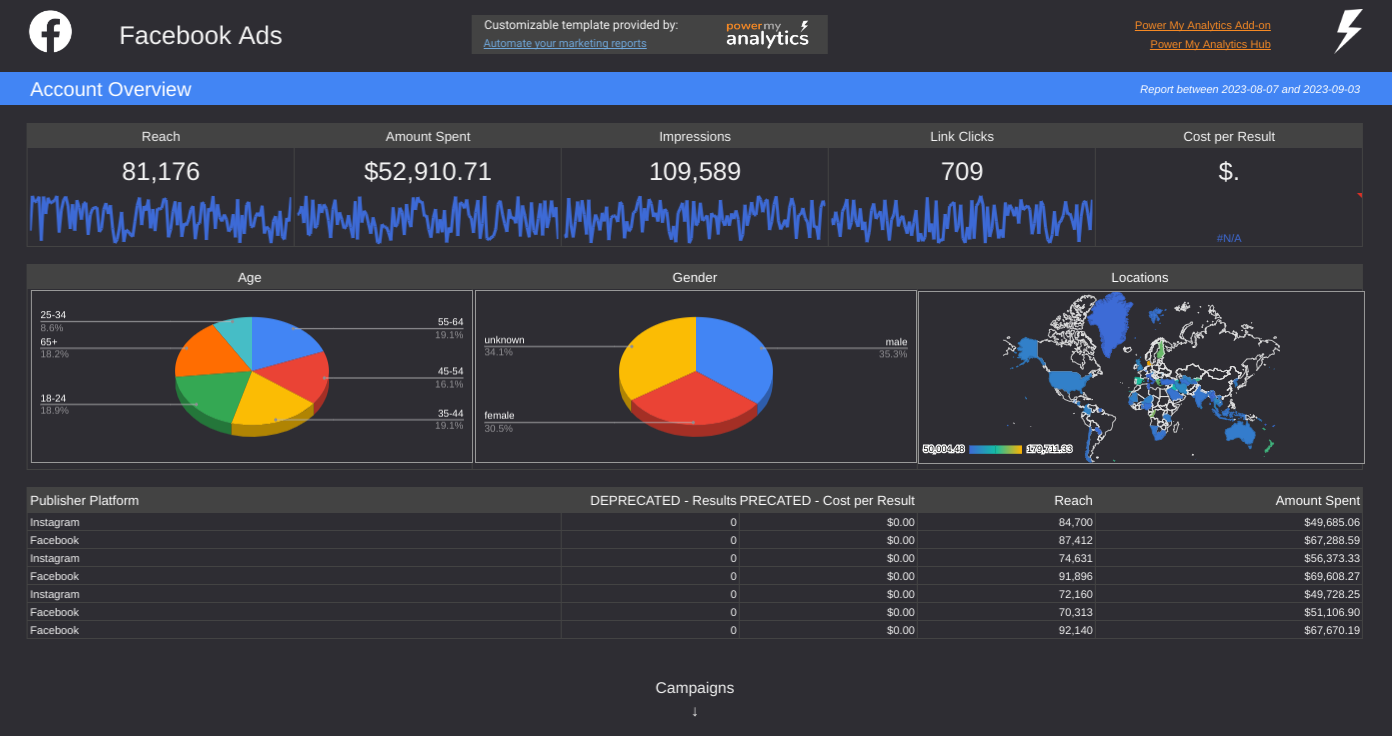
Template dashboards
There are impressive dashboards created by Power My Analytics (I will show some of them). They look really similar to Looker Studio dashboards but probably they’re much more difficult to create. Adjusted to the type of device, giving an option of color scheme – that’s a lot of work, huh?
Check them out here

Custom report
Settings
Once again setting everything up in a sidebar. Clicking Report – Add report. First of all, we need to find a connector for the platform we’ll use – Facebook Ads. Then we select a Data account, where we choose the account we used to log in Power My Analytics and followingly the Facebook account – it can be either your personal account or Demo account (here called Sample).
Then we have the same old configurations of the seed, magnitude currency as well as the date range. Here I’ve chosen Last 28 days as well.
Next thing is dimensions and metrics setup. What is interesting here – Facebook has slightly different dimensions and metrics nomenclature. Keep this in mind while choosing the fields.
As a dimension I’ve chosen date and as metrics – Amount Spent (that is actually a name for the Cost), Reach, Impressions, Clicks (All), CTR (All). Besides all that, Facebook offers 1001 varieties of the same metric, for example, Conversion. A simple Conversion, Offline other conversions, Unique website conversions, Learning Stage Info conversions and so on. There are some kinds of conversions that are called “ On-Facebook Leads” or “Purchases”. So, be aware of this tricky moment. To avoid it, just check your Facebook Ads account and pay attention to the campaign results.
I don’t want to set up any filters. Talking about special options, I chose not to show the report header, all time values, “no data” and grid lines. Then I named my report Fb_test.
Then I select the cell A1. It is essential to create a new tab and select a cell where you want Power My Analytics to insert the data. Otherwise, it will be added to any cell your mouse has selected, so be aware. After that you can click the “Create report” button.
Table
As we can see in the table (image) the CTR is 0. But when we count it manually, we get the right value. So what I usually do is use formulas and count the true values of the fields to avoid mistakes. Considering finding the right metric for Conversions – you should really check what metric is used in your Facebook Ads account.
Summary
I usually use connectors to pull data to Google Sheets first rather than to Looker Studio because, first of all, I usually mix it with some other kind of data, like Bing Ads, Google Ads data or something else. It is much easier to use Google Sheets to blend data, because truly Google Sheets does it much better. Google Sheets has much more formulas that help you transform data than Looker Studio.
Secondly, Facebook Ads update their API quite often, so when you have Facebook Ads connected directly to Looker Studio, the probability to have some issues with your report is higher. Using Google Sheets you won’t show the freshest data due to the refreshing frequency but at least you will be able to see all the data without any broken charts.
The third reason is basically the speed. When you pull data directly to the Looker Studio, it is all being processed in the real time, consequently taking more time. Using Google Sheets as an intermediary will surely make your Looker Studio dashboard work faster.
Let me know if you liked this article! Share your opinion about this connector in the comments section! Don’t forget to subscribe for a newsletter!