
Supermetrics Facebook Ads add-on for Google Sheets

Supermetrics Facebook Ads add-on for Google Sheets is a powerful tool that allows users to import and analyze Facebook Ads data directly in Google Sheets. In this article I am going to review this add-on and check how it works.
Here is the video tutorial:
If you have never worked with Supermetrics add-on
Starting to work with Supernetrics, primarily you need to install the Supermetrics add-on. There is going to be a pop-up window on your screen. In the Marketplace search box you need to write Facebook to find the list of add-ons that can provide data from Facebook. Having found Supermetrics, you just need to install it. Then you will be able to see this add-on in Extensions. After that you just need to launch the sidebar.
Functionality and pre-setup
What are the first options available for us? We can refresh all the sheets or just the active sheet, manage queries, schedule refreshment and emailing, duplicate this file for another account and get access to the template gallery.
Let’s talk more about pulling data from Facebook Ads to Google Sheets.
Basically, we have an empty sidebar and to start working with it we need to click Create a query. Then we will see a big list of connectors but we only need Facebook Ads for now. Right after clicking you will be sent to the authorization tab to connect Supermetrics to your Facebook Ads account.
Working with add-on
Now the sidebar is full of menus, let’s take a look.
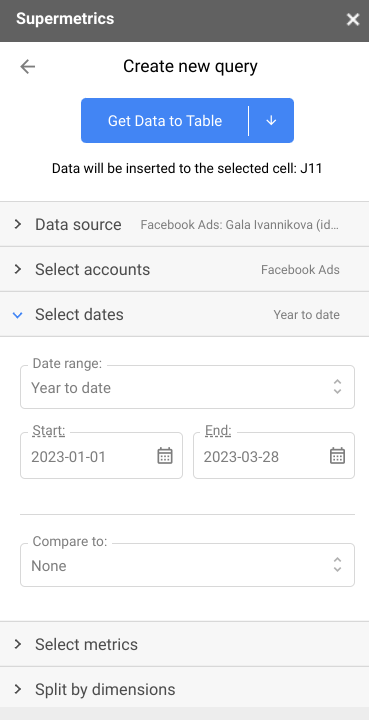
Firstly, we have a data source, where you can see your Facebook Ads page connected. Here you can add a new user or log out.
The following menu gives us access to the ads accounts (and you are able to select all of them, if you need!). Next menu is setting up a data range. Here are options of selecting some default date range from a huge list and also you can compare selected data to data in some period of time in the past. To get the full most recent data, I usually set up a data range until yesterday (because today is not finished yet).
Then, there are a lot of metrics split by categories. I think this is really useful. You can see the metrics mostly in numbers – something you can count. After that you can split your tables by dimensions. In Split to rows I’ve selected Year & Month and in Split to Columns – Week (Mon-Sun). In the same section you’re able to select a number of rows shown and sort them. Additionally, here you can set up secondary sorting and sort directions.
After that you can add some filters and also there is a list of useful options. For example, replace blank metric values with zero (a very handy option while connecting the Sheets to the Looker Studio) or right away you may format the results for Looker Studio, don’t show header row, combine new results with old. One of the options I want to highlight is “Keep previous results on refresh error. It’s quite new; in the past when there was an error in updating you would have error messages and the charts containing this field would be broken. But now there won’t be anything broken, but the data will be obviously outdated.
“Disable unified attribution settings” is a really interesting setting in terms of Facebook Ads. In Facebook Ads you can have different attribution models. If you have two campaigns with two different attribution models, you won’t be able to see, for example, Conversions in your Google Sheets.
Advanced settings
In this subsection you can highlight values with colors. Conversion window is a bit complicated – sometimes I just need to click each of the options to see which one works, but only when I don’t have access to a Facebook Ads account. Otherwise, you can open your Facebook ads account and see what attribution you have there. Then you have a time of action stats and some advanced settings.
Having everything set, to pull up the data to Google Sheets we need to click “Get data to table”.
Google Sheets moments
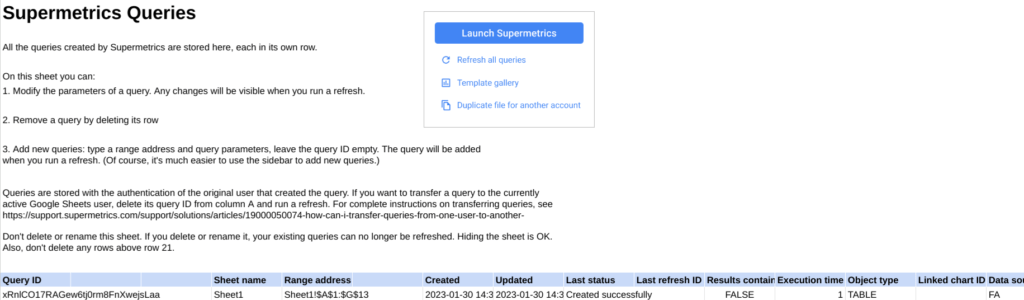
In the tab in the bottom of your Google Sheets, where you actually have the tabs, there is a menu. There is a Supermetrics Queries tab where you can actually see all the queries and the default information. After our query was completed successfully, we can see it there in the list.
Let’s take a look at the table. Personally I don’t like it. Basically, you can modify the query and make some changes. After adjusting the table to the good view, what do I usually do:
- Make the header row bold
- If there are a lot of rows in the table, I pin up the header row
- In the sidebar in Schedule tab I add a trigger for the table refreshment that means that at exact day of the week at exact time the data will refresh
Query tab
On this page there are some settings and all the information about this Sheet. If you want to make any adjustments, there is no need to open the sidebar all the time, you can do everything on this page. For example:
- Change account
- Change metrics and dimensions
- Max number of rows etc.
Hope you liked this article! Leave your questions and impressions in the comments section! You can read my other articles in my blog or Medium.