
Ecommerce sales funnel of an online store in Google Data Studio

If the e-commerce reports are set up, the sales funnel is graphically illustrated in Google Analytics. On one screen you see a general number of sessions, sessions with adding products to the cart and transactions.
It is very convenient but sometimes you need to change the levels of your ecommerce sales funnel, to add some details or simply to brand the report and send it to the client in *.pdf format. For these cases it is comfortable to use Google Data Studio but how to replicate sales funnel report in GDS is not obvious at all. In the article I am talking about the way I set up the sales funnel in Google Data Studio for my client’s online store.
Report template and preliminary set-up
Report template and preliminary set-up
You can find the report template by the link.
In order to copy the report for your project you need to have a previously set up account in Google Analytics having the reports of enhanced e-commerce turned on. If you haven’t set up e-commerce in GA yet, there is an official Google help link.
For the template I was using a Google Analytics demo-account. Here is the link to the help center where it is said how to obtain an access to it.
How to create a sales funnel in Google Data Studio by yourself?
Basing on my customers’ requests, I have changed a little bit a Google Analytics default sales pipeline. However my template is easy to update in usual GA. Let’s have a detailed look at the report.
First section – a simple sales funnel
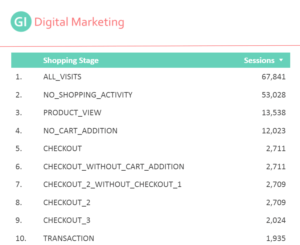
If you try to find the fields named “Product view”, “Added to the cart” etc. in a usual GA connector, you won’t see these fields. But here we (unexpectedly) have the parameter called “Shopping Stage” to help us. If you create a simple table with a “Shopping Stage” dimension, you are going to see more or less 20 stages.
The solution is coming up straight away, isn’t it? If you have worked with Google Data Studio before, the next step is going to be obvious for you – we are creating the filters with necessary stages and a basic sales funnel is ready!
For the ones who do it for the first time, I am showing. We create the object in Scorecard type.
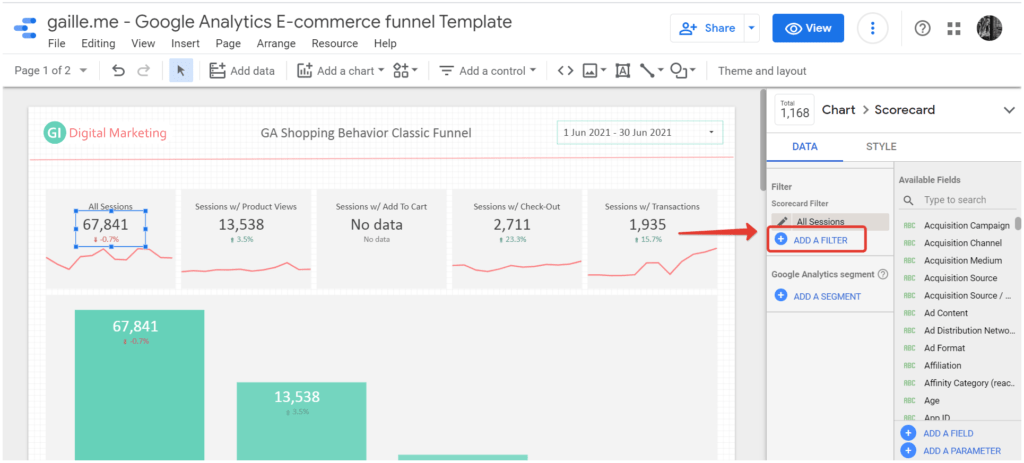
In filter settings we refer a parameter for Shopping Stage filtration is equal, and choose a needed stage. For instance, for all the visits the filter is going to look like this.

Now I am going to show the values for all the levels of a sales funnel.
- All the sessions: Shopping Stage = ALL_VISITS
- Sessions with Product Views: Shopping Stage = PRODUCT_VIEW
- Sessions with Add to Cart: Shopping Stage IN ADD_TO_CART_WITH_VIEW, ADD_TO_CART_WITHOUT_VIEW
- Sessions with Check-Out: Shopping Stage IN CHECKOUT_WITH_CART_ADDITION, CHECKOUT_WITHOUT_CART_ADDITION
- Sessions with Transactions: Shopping Stage = TRANSACTION
The red line under the main figure is showing the same funnel’s level but in the dynamics for the last 12 months. It is useful as you can spectate the changes in quantity of sessions on each stage of the funnel over the long distance.

How to create a sales funnel’s bar chart?
The trick with the filters is cool without any doubts but for a bar chart it is not an appropriate thing that is why we have to look for other options.
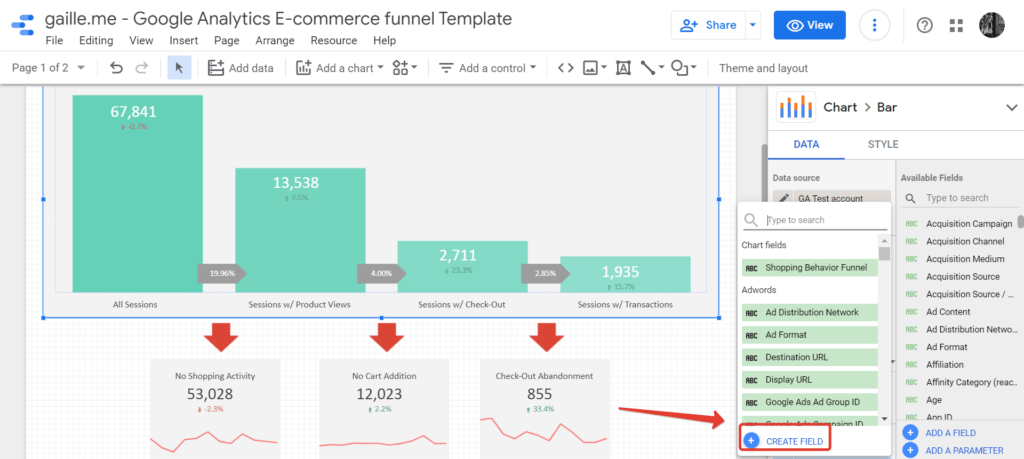
For example, we can create a custom parameter “Shopping Behavior Funnel”!
We create a new element that is a bar chart, and we choose sessions as metrics and we create a new field of a parameter.
I called the field “Shopping Behavior Funnel” and in the formula field I added the scheme. You can simply copy it into your report or if you have the understanding of what is said below, you can fix it according to your requests.
CASE
WHEN REGEXP_MATCH (Shopping Stage, «ALL_VISITS») THEN «All Sessions»
WHEN REGEXP_MATCH (Shopping Stage, «CHECKOUT_WITH_CART_ADDITION») THEN «Sessions with Check-Out»
WHEN REGEXP_MATCH (Shopping Stage, «CHECKOUT_WITHOUT_CART_ADDITION») THEN «Sessions with Check-Out»
WHEN REGEXP_MATCH (Shopping Stage, «ADD_TO_CART_WITHOUT_VIEW») THEN «Sessions with Add to Cart»
WHEN REGEXP_MATCH (Shopping Stage, «ADD_TO_CART_WITH_VIEW») THEN «Sessions with Add to Cart»
WHEN REGEXP_MATCH (Shopping Stage, «TRANSACTION») THEN «Sessions with Transactions»
WHEN REGEXP_MATCH (Shopping Stage, «PRODUCT_VIEW») THEN «Sessions with Product Views»
END
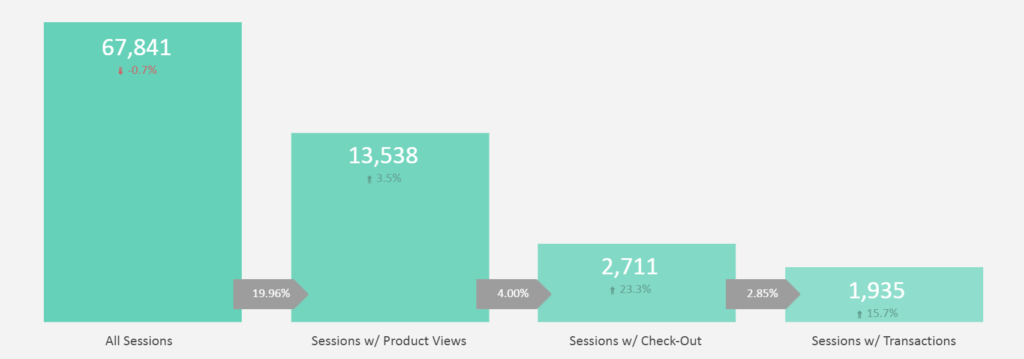
Is that cool? So here is the diagram fully done. I didn’t visually like the default captions to the chart, so I hid them and added separate elements with the values for each stage of the funnel.
That’s how I did to the axis of the chart – I hid them and added separate text blocks.
What about little gray arrows?
The arrows themselves are inserted as the images. But the data upon them is calculated with the help of Blended data datasource. It looks like this.

I create a general datasource basing on one Google Analytics account but in each source I use a different filter according to a sales funnel’s stage.
I have chosen “User Type” and “Device Category” as a field for integration, in order to create analytics using these sections.
I am always stating the sessions as metrics but for each source of traffic I rename the field so that I can not get lost using it.
And for every datasource I apply the filters I was using to create a simple sales funnel on the top of the page.
I called this integrated data-source “GA Funnel Sessions” and it consists of 5 sources according to the stages of the funnel.
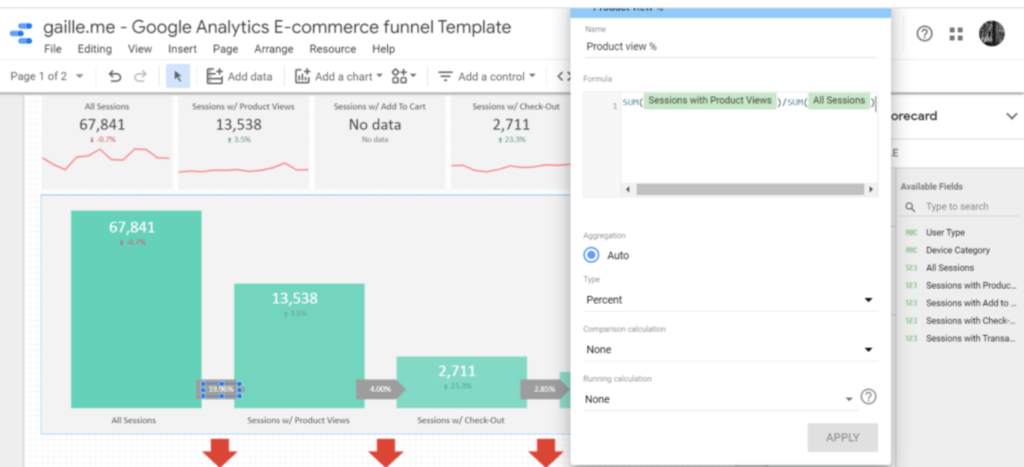
When the datasource is ready, we create a new Scorecard type element and as a metric we create a new field.
For instance, let’s take “Product view %”. It is a ratio of the sessions with reviewing any product card regarding all the sessions. This is what we are going to write with a formula.
sum(Sessions with Product Views)/sum(All Sessions)
In the formula I am selecting a method of aggregation because you are going to have the right result only this way. If you do not state sum(), your daily sessions will be counted separately and at the same time they will be summed for the general period.
An example with test data for 3 days.
All Sessions: 15, 20, 18
Sessions with Product Views: 8, 12, 13
A right way to count the conversion is : (8+12+13) / (15+20+18) = 33 / 53 = 62,2%
If you don’t state sum() into the formula, you are going to have a result like this:
8/15 + 12/20 + 13/18 = 0,533 + 0,6 + 0,722 = 186%
I hope you don’t have any doubts.
As data type we select percentages. It looks like this.
We write the formulas for the rest of the arrows in the same way. Concurrently we always divide by the general number of sessions. If you need to get the conversion regarding the previous stage, you can divide it by the value of the previous stage.
Section of abandoned carts
Below the car chart we have a section consisting of 3 objects that are showing us a number of sessions without actions. Here, like in the upper block, you can solve everything with the help of filters.
I will put the measures to the filters.
- No Shopping Activity: Shopping Stage = NO_SHOPPING_ACTIVITY
- No Cart Addition: Shopping Stage = NO_CART_ADDITION
- Check-Out Abandonment: Shopping Stage = CHECKOUT_ABANDONMENT

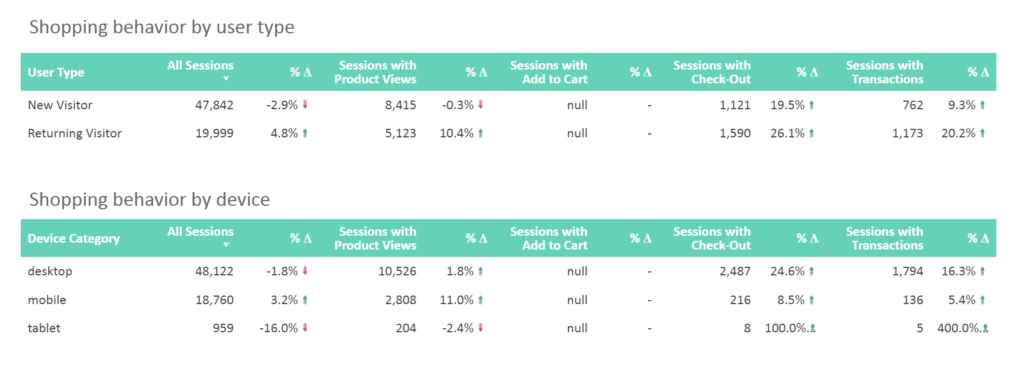
A sales funnel for new and returning customers disaggregated by device types
Two last charts are created based on Blended data datasource that we were creating for a bar chart.
Create a new chart and select necessary fields. As a result, I have these tables.
Conclusion
We have finished reviewing our Google Data Studio report – Sales funnel for online stores based on Google Analytics.
I have tried to tell as easy and as detailed as I can about how I have made this much of a useful report and I hope you like it and you will use it in your work.
If you liked the report but you do not have time to create it yourself – you can always ask me for help. I will be glad to help you analyze your data!
You can find my other articles by the link.