
Business Data Analytics

According to a study by MicroStrategy, companies worldwide are using data to:
- Improve efficiency and productivity (64%)
- Achieve more effective decision-making (56%)
- Drive better financial performance (51%)
The research also shows that 65% of global enterprises plan to increase analytics spending. In light of these market trends, gaining an in-depth understanding of business analytics can be a way to advance your career and make better decisions in the workplace.
Before diving into the benefits of data analysis, it’s important to understand what the term “business analytics” means.
What is business data analytics?
Business analytics is the process of using quantitative methods to derive meaning from data to make informed business decisions.
There are four primary methods of business analysis such as:
- Descriptive: The interpretation of historical data to identify trends and patterns
- Diagnostic: The interpretation of historical data to determine why something has happened
- Predictive: The use of statistics to forecast future outcomes
- Prescriptive: The application of testing and other techniques to determine which outcome will yield the best result in a given scenario
These four types of business analytics methods can be used individually or in tandem to analyze past efforts and improve future business performance.
In simpler terms, data analytics serves as a broad overview of the contemporary analytical process, encompassing various data-driven activities. On the other hand, business analytics implies a more specific concentration, gaining importance as data volumes surge worldwide.
Employing cloud analytics platforms, businesses can work with the data from different departments such as sales, marketing, HR, and finance, offering a perspective on interdepartmental impacts. Additionally, through tools such as visualization, predictive analysis, and scenario simulation, organizations unlock diverse insights influencing their entire operations.
Advantages of Business Analytics
Business analytics benefits impact every corner of your organization. When data across departments consolidates into a single source, it syncs up everyone in the end-to-end process. This ensures there are no gaps in data or communication, thus unlocking benefits such as:
- More Informed Decision-Making:
Analytics surely eliminates guesswork, which minimizes potential financial loss. Business analysts basically understand the organization’s goals and use analytics to guide data-driven business decisions. The past data of the company, current market situation, and product performance are leveraged to predict future trends and accordingly design strategies.
- Monitor progress and performance:
Business analytics can be used to track the progress of the organization over the years. It can also identify the performance of a product or a strategy in the market. Based on these reports, it can be deduced what is working well for the organization and what isn’t. As a result, updated decisions and methodologies can be implemented to improve the stats.
- Optimizes customer outreach:
Analytics can help target customers in a more personalized manner. All successful businesses have figured out the secret to success – making their customers happy! Organizations today, identify their customer base, understand their needs and behaviors and correspondingly cater to them. This is possible because of the statistical tools and models used in business analytics.
- Mitigates risk:
Basically, analytics can empower companies to identify risk factors and take preventive measures. Certainly, the main advantage of business analytics is its ability to mitigate risks. It helps in tracking the mistakes made by the organization in the past and understanding the factors that led to their occurrence. With this knowledge, analysis is done to predict the probability of the reoccurrence of similar risks in the upcoming future, and therefore, the corresponding measures can be taken to prevent the same.
- Improved Operational Efficiency:
Analytics can reveal vulnerabilities in processes like supply chain issues.
Tools for Analytics for Businesses
Business data analytics has many individual components that work together to provide insights. While business analytics tools handle the elements of crunching data and creating insights through reports and visualization, the process actually starts with the infrastructure for bringing that data in. A standard workflow for the business analytics process is as follows:
Data collection: Wherever data comes from, be it IoT devices, apps, spreadsheets, or social media, all of that data needs to get pooled and centralized for access. Using a cloud database makes the collection process significantly easier. For example, Google Sheets and BigQuery.
Data mining: Once data arrives and is stored (usually in a data lake), it must be sorted and processed. Machine learning algorithms can accelerate this by recognizing patterns and repeatable actions, such as establishing metadata for data from specific sources, allowing data scientists to focus more on deriving insights rather than manual logistical tasks.
Descriptive analytics: What is happening and why is it happening? Descriptive data analytics answers these questions to build a greater understanding of the story behind the data.
Predictive analytics: With enough data—and enough processing of descriptive analytics —business analytics tools can start to build predictive models based on trends and historical context. These models can thus be used to inform future decisions regarding business and organizational choices.
Visualization and reporting: Visualization and reporting tools can help break down the numbers and models so that the human eye can easily grasp what is being presented. Not only does this make presentations easier, these types of tools can help anyone from experienced data scientists to business users quickly uncover new insights. I prefer to use Looker Studio.
About Gaille Reports and marketing analytics
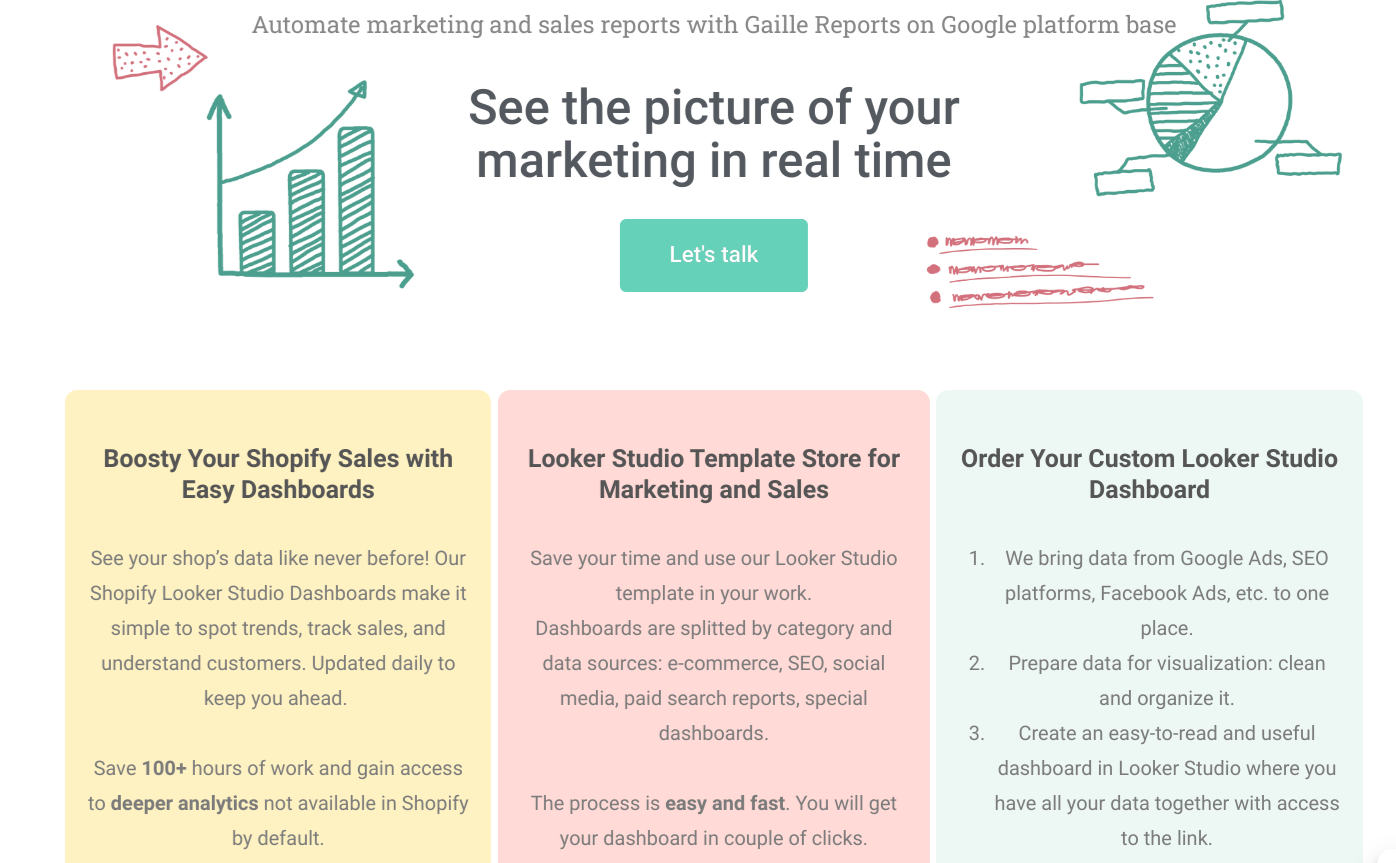
Gaille Reports digital marketing agency specializes in using the power of analytics to drive business growth and success. Our expertise lies in utilizing advanced analytical tools and techniques to provide actionable insights that empower businesses to make informed decisions and optimize their marketing strategies.
With Gaille Reports by side, businesses can leverage data-driven approaches to enhance their marketing efforts and maximize their ROI. Through comprehensive analytics solutions, we offer in-depth analysis of customer behavior, campaign performance, and market trends, enabling businesses to identify opportunities for growth and stay ahead of the competition.
Usefulness of Looker Studio dashboards in business analytics
Looker Studio dashboards are powerful tools for businesses aiming to enhance their analytics capabilities. Here are several ways in which these dashboards help businesses with analytics:
- Data Visualization:
- Looker Studio transforms raw data into easy-to-understand visual formats such as charts, graphs, and maps. This visual representation helps businesses quickly grasp insights and trends that might not be apparent from raw data alone.
- Real-Time Reporting:
- The dashboards can pull data in real-time, providing up-to-date information. This allows businesses to make informed decisions based on the most current data available.
- Customizable and Interactive Reports:
- Businesses can create custom dashboards tailored to their specific needs. Interactive features like filters and date range selectors enable users to drill down into the data, explore different dimensions, and gain deeper insights.
- Integration with Multiple Data Sources:
- Looker Studio supports integration with various data sources, including Google Analytics, Google Ads, BigQuery, and third-party data connectors. This capability allows businesses to consolidate data from different platforms into a single dashboard for a comprehensive view.
- Collaboration and Sharing:
- You can easily share dashboards with team members, stakeholders, or clients, promoting collaboration.
- Automated Data Refresh:
- Businesses can schedule automatic data refreshes to ensure their dashboards always reflect the latest data without manual intervention. This automation saves time and reduces the risk of errors.
- Enhanced Decision-Making:
- By providing a clear and comprehensive view of key metrics and performance indicators, Looker Studio dashboards support strategic planning and decision-making. Businesses can identify opportunities, detect issues early, and track the impact of their actions.
- Cost-Effective Solution:
- Looker Studio is a free tool, making it a cost-effective solution for businesses of all sizes. It provides robust features without the need for significant financial investment in expensive analytics software.
- Performance Tracking:
- Businesses can track performance against goals and benchmarks using custom metrics and KPIs. This continuous monitoring helps in evaluating the effectiveness of strategies and initiatives.
- Enhanced Client Reporting:
- For agencies and consultants, Looker Studio dashboards offer an efficient way to create professional reports for clients. Custom branding options and templates ensure that reports are visually appealing and aligned with client expectations.
Whether it’s optimizing advertising campaigns, refining website performance, or understanding customer preferences, Gaille Reports offers tailored analytics solutions to suit the unique needs of each business. You can book a call with us to know how we can be useful for your business.
In addition, in our template store there are various report templates that offer solutions for routine marketing tasks, so check it out!