
3 levels of filters in Looker Studio: report, page, chart filters

There are 3 levels of filters in Looker Studio: report, page and chart filters. They make your experience of using the dashboard easier and I will explain why and how to create them in this article.
But before reading check out the video:
How to add a filter?
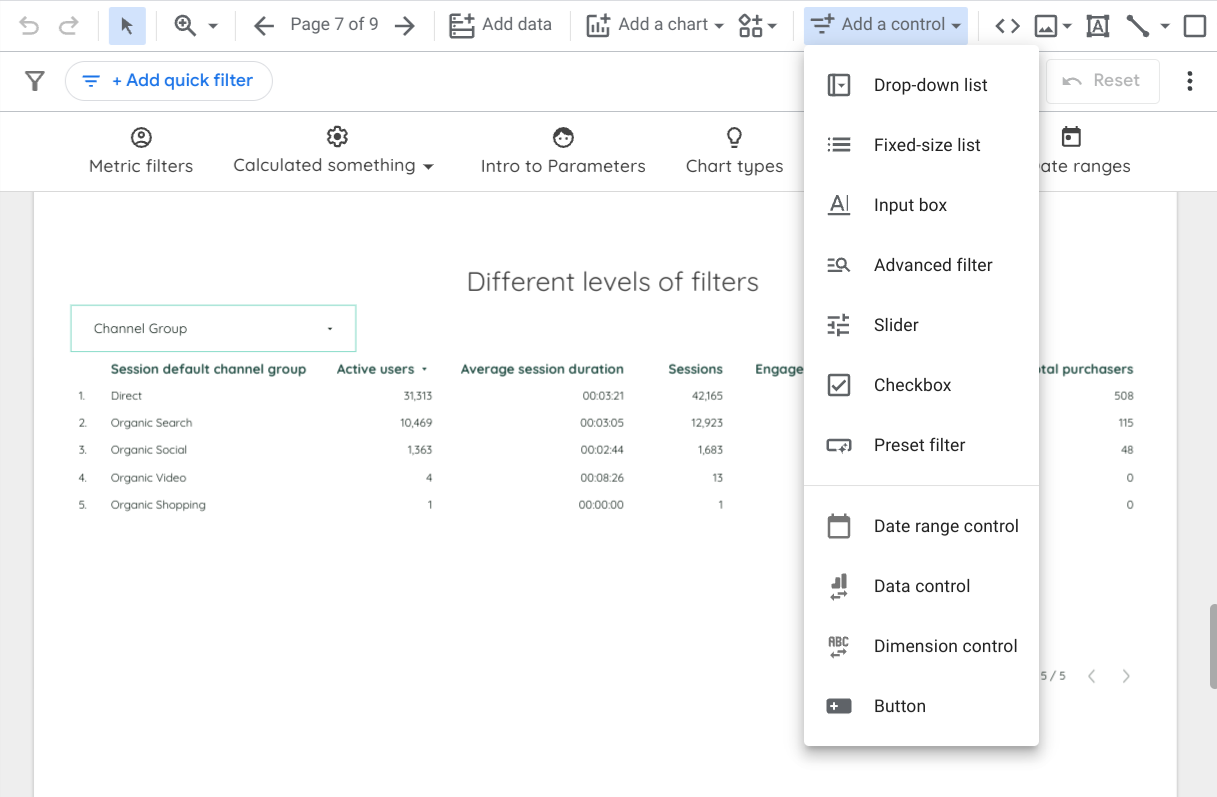
Clicking the “Add control” menu, you will get a list of controls you can apply to your dashboard.
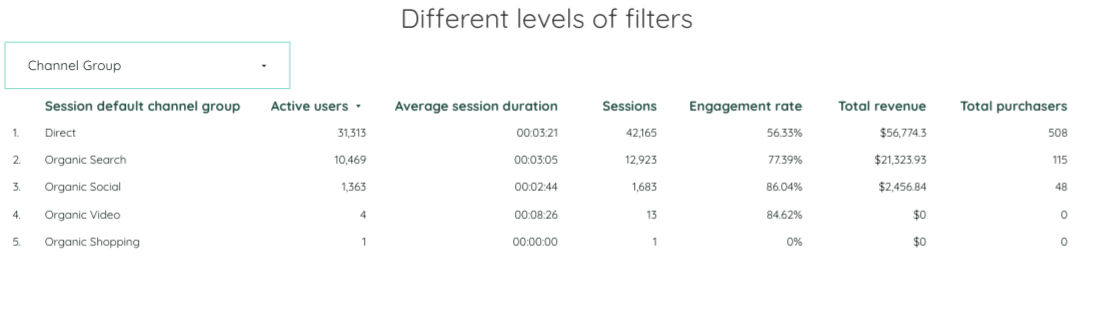
For example, in the image above you can already see a filter above the table. To create a filter linked to a certain chart, select it by clicking, then select a control you want to add. In this case I’ve used a “Drop-down list” filter.
How to check if everything is right?
- Data source in the filter and in the chart has to be the same
- Dimension in the filter and in the chart need to be the same (if your table has several dimensions, filter has to match one of them)
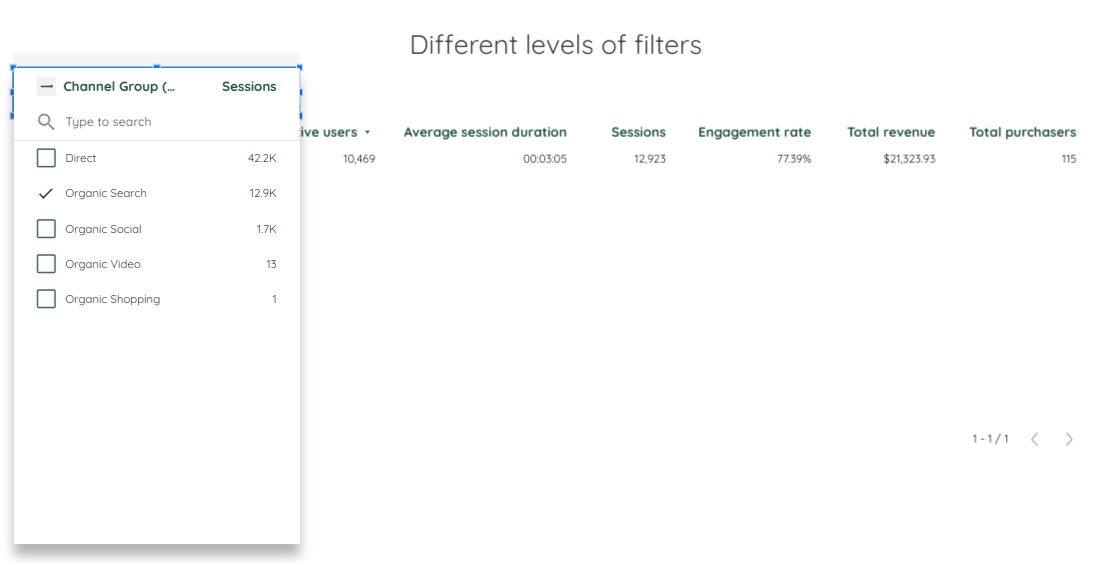
So, in this case the filter helps you filter your Channel Groups – to show only one or some of them.
That’s pretty simple, isn’t it? Let’s move to another type of filter!
Chart filters
This is an in-built filter you need to create for the chart. To do it, having selected a chart in your right settings panel, find the “Filters” section and click “Create a filter”.
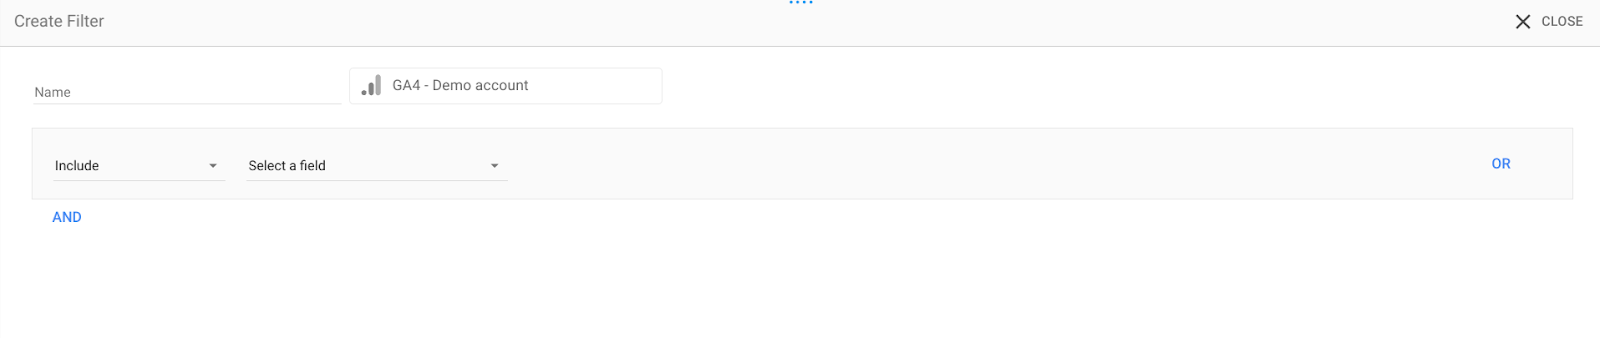
There will be a window on your screen with a filter setting. Here is where you need to create a condition to apply to the chart.
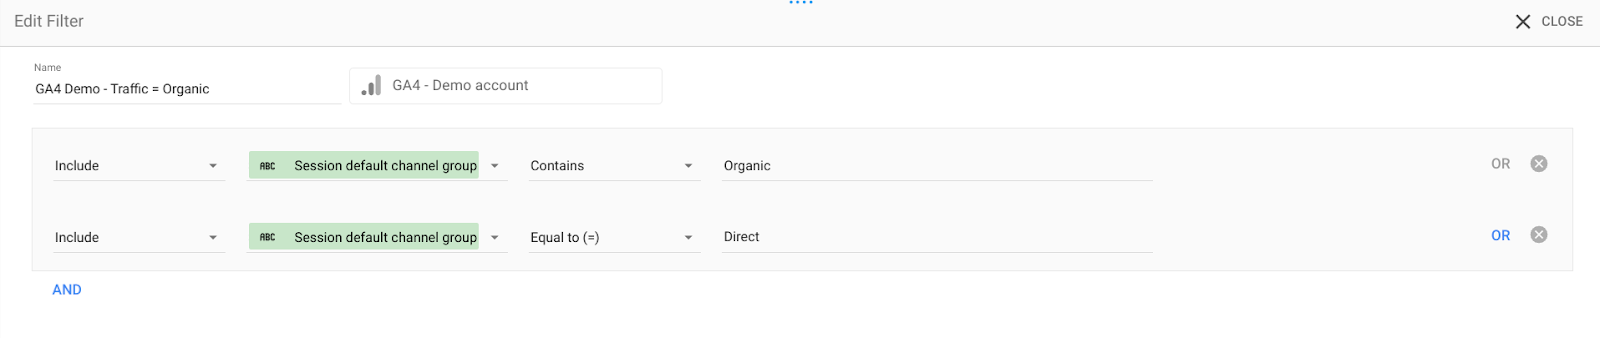
To create an organic traffic filter based on our previous chart, we need Session default channel grouping to contain the word “Organic”. To make an alternative rule we need to click a blue “OR”. It means that to be recognised by this filter, at least one of the created conditions needs to be fulfilled. In case you need two conditions to be met at the same time, you have to click a blue “AND”.
After applying this filter – this is what we have – matches that contain Direct and Organic sessions. Moreover, further you can apply this filter to any charts and even controls.
Page filter
To create a page filter, go to the menu “Page” →”Current page settings” and in the right panel you will see the section “Filters”. First of all, you can choose a default page data source and you are ready to create a filter.
You can create a new one or use the one we’ve created a moment ago! Selected filter will be automatically applied to all the charts on the page.
Every chart will be enabled with a function “Inherit filters” and you will be able to choose whether a certain chart needs this filter.
Report filter
Did you know that you could add filters to the whole dashboard? Let me show you how!
Click the menu “File” → “Report Settings”. Here is pretty much the same – we can select a default data source again and we have an option between new and existing filters.
Advantages of filters in Looker Studio
Filters in Looker Studio are important for several reasons:
- Data Exploration: Filters allow users to quickly drill down into specific subsets of data. This is crucial for exploring data and gaining insights. Users can narrow down their focus to particular time ranges, geographic regions, product categories, or any other relevant dimensions.
- Customization: Filters provide flexibility in data visualization. Users can customize their views by applying filters to tailor the data to their specific needs or questions. This customization enhances the relevance and usefulness of the visualizations.
- Interactivity: Filters enable interactivity in dashboards and reports. Users can dynamically change the data displayed by adjusting filter settings, allowing for real-time exploration and analysis. This interactivity promotes engagement and empowers users to extract insights more effectively.
- Data Analysis: Filters facilitate in-depth data analysis by enabling users to isolate specific segments of data for comparison or analysis. Whether it’s comparing performance across different regions or analyzing trends over time, filters make it easier to focus on the relevant data points.
- Performance Optimization: Applying filters can improve dashboard performance by reducing the volume of data processed and displayed. Filtering data at the source before visualization reduces processing overhead and speeds up dashboard loading times, enhancing the user experience.
- Data Security: Filters can also be used to enforce data security and access controls. By applying filters based on user roles or permissions, organizations can ensure that users only see the data they are authorized to access, protecting sensitive information.
Check out a new report template in our template store – New and Returning Customers Growth report.
Hope you liked this article! Please, share with us you opinion, what Looker Studio feature should we overview else?